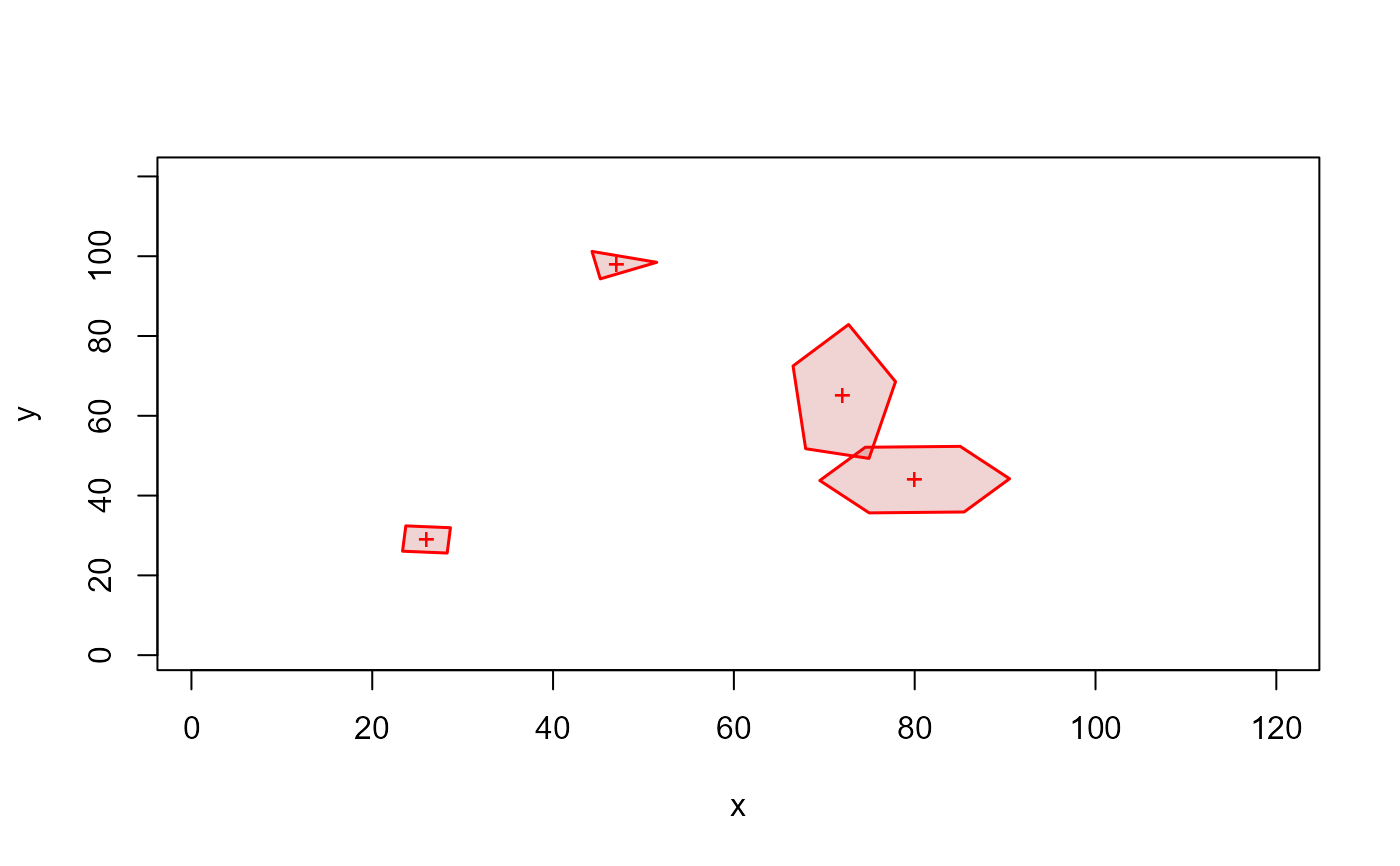
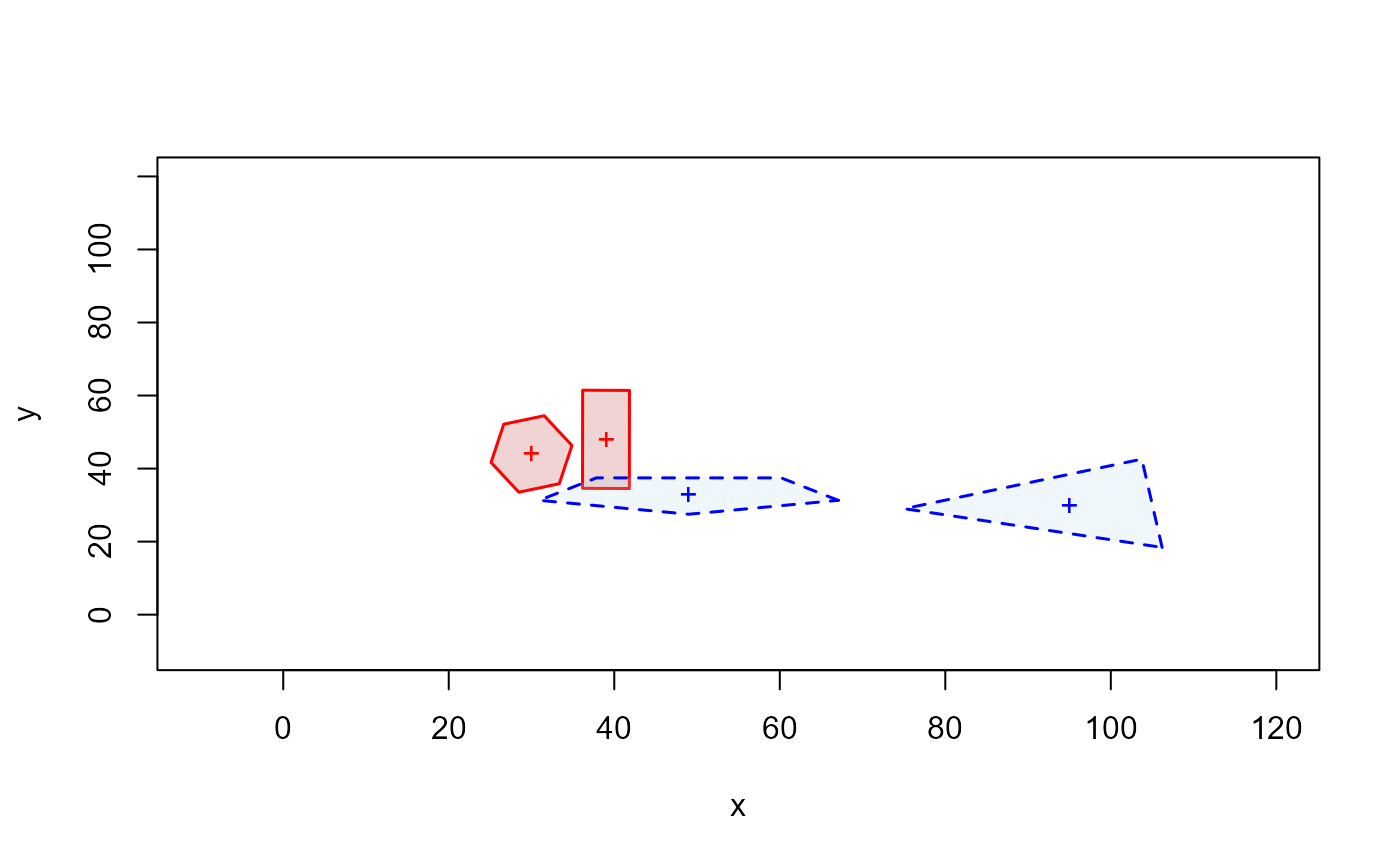
Given x and y coordinates of the polygon(s)' center as well as width, height, number of sides, and rotation angle, this function returns a list containing the coordinates of the polygon(s) vertices and draw it.
Usage
polygons(
  x = NULL,
  y = NULL,
  width = NULL,
  height = NULL,
  sides = NULL,
  rotation = 0,
  center = TRUE,
  col = NULL,
  border = "black",
  lwd = 1,
  lty = 1,
  draw = TRUE
)
Arguments
- x
A single numeric value or a vector corresponding to the x value of the center of polygons
- y
A single numeric value or a vector corresponding to the y value of the center of polygons
- width
A single numeric value or a vector specifying the width of the polygons to generate.
- height
A single numeric value or a vector specifying the height of the polygons to generate.
- sides
A single numeric value or a vector specifying the number of sides belonging to the polygons to generate.
- rotation
A single numeric value or a vector specifying the angle of rotation of the polygons in radians.
- center
Either TRUE or a single integers or a vector of integers specifying the symbol(s) or a single character to be used to represent the polygons center (see
pointsfor possible values and their interpretation).- col
The color or a vector of colors for filling the polygons, the default leaves polygons unfilled.
- border
The color or a vector of colors to draw the border of the polygons (default = "black").
- lwd
The value of line width or a vector of line width of the polygons border (default = 1).
- lty
An integer or a vector of integer corresponding to line type to be used for drawing polygons border, as in par (default = 1).
- draw
A logical value (i.e., TRUE or FALSE) indicating whether the polygons should be drawn or not (default = TRUE).
Value
This function returns a list containing the coordinates of the points generated on contour of the polygon(s) (i.e., vertices). Each element of the list correspond to a polygon (an ROI). In case only one polygon is generated the function returns a dataframe. The function can also draw the circles on an existing plot window or, if there is no active plot window, on a new plot window.
Examples
 set.seed(2023)
 plot(NULL, xlim = c(1,120), ylim = c(1,120), xlab = "x", ylab = "y")
 # draw 4 red-border and red-filled polygons of different shape, size and angle on a new plot
 polygonsCoords1 <- MoveR::polygons(
   x = sample(1:100, 4),
   y = sample(1:100, 4),
   width  = sample(5:40, 4),
   height = sample(5:40, 4),
   sides = sample(3:6, 4),
   rotation = sample(seq(0, 2*pi, 0.5), 4),
   center = TRUE,
   border = "red",
   col = adjustcolor("firebrick", alpha = 0.2),
   lwd = 1.5,
   lty = 1,
   draw = TRUE
 )

 str(polygonsCoords1)
#> List of 4
#>  $ ROI_1:'data.frame':	6 obs. of  2 variables:
#>   ..$ x.pos: num [1:6] 85.5 90.5 85 74.5 69.5 ...
#>   ..$ y.pos: num [1:6] 35.9 44.2 52.3 52.1 43.8 ...
#>  $ ROI_2:'data.frame':	3 obs. of  2 variables:
#>   ..$ x.pos: num [1:3] 45.2 51.5 44.3
#>   ..$ y.pos: num [1:3] 94.3 98.5 101.2
#>  $ ROI_3:'data.frame':	5 obs. of  2 variables:
#>   ..$ x.pos: num [1:5] 67.9 74.9 77.9 72.7 66.5
#>   ..$ y.pos: num [1:5] 51.7 49.3 68.6 82.9 72.5
#>  $ ROI_4:'data.frame':	4 obs. of  2 variables:
#>   ..$ x.pos: num [1:4] 23.7 23.4 28.3 28.6
#>   ..$ y.pos: num [1:4] 32.4 26.1 25.6 31.9

 # draw 2 red-border and red-filled circles and 2 blue-border and blue-filled circles of different size on a new plot
 plot(NULL, xlim = c(-10,120), ylim = c(-10,120), xlab = "x", ylab = "y")
 polygonsCoords2 <- MoveR::polygons(
   x = sample(1:100, 4),
   y = sample(1:100, 4),
   width  = sample(5:40, 4),
   height = sample(5:40, 4),
   sides = sample(3:6, 4),
   rotation = sample(seq(0, 2*pi, 0.5), 4),
   center = TRUE,
   border = c(rep("red", 2), rep("blue", 2)),
   col = c(rep(adjustcolor("firebrick", alpha = 0.2), 2), rep(adjustcolor("lightblue", alpha = 0.2), 2)),
   lwd = 1.5,
   lty = c(rep(1, 2), rep(2, 2)),
   draw = TRUE
 )

str(polygonsCoords2)
#> List of 4
#>  $ ROI_1:'data.frame':	6 obs. of  2 variables:
#>   ..$ x.pos: num [1:6] 31.5 26.6 25.1 28.5 33.4 ...
#>   ..$ y.pos: num [1:6] 54.5 52.2 41.7 33.5 35.8 ...
#>  $ ROI_2:'data.frame':	4 obs. of  2 variables:
#>   ..$ x.pos: num [1:4] 41.8 36.2 36.2 41.8
#>   ..$ y.pos: num [1:4] 61.4 61.5 34.6 34.5
#>  $ ROI_3:'data.frame':	3 obs. of  2 variables:
#>   ..$ x.pos: num [1:3] 106.2 103.7 75.1
#>   ..$ y.pos: num [1:3] 18.4 42.6 29
#>  $ ROI_4:'data.frame':	5 obs. of  2 variables:
#>   ..$ x.pos: num [1:5] 67.1 60.2 37.8 30.9 49
#>   ..$ y.pos: num [1:5] 31.3 37.4 37.4 31.3 27.5