We are starting with a basic example of importing raw data from tracking software.
For this example we are selecting the first sample of data available in the MoveR_SampleData github repository.
Briefly, this dataset come from the video recording (image resolution: 3840x2160) of 12 parasitic micro-wasps (genus Trichogramma) placed in a polygonal arena for 8 minutes at 25 fps (see fig. 1 below) and tracked using TRex (Walter and Couzin, 2021).

Figure 1: Frames extracted from a video recording of 12 parasitic micro-wasps (genus Trichogramma) placed in a polygonal arena.
Download sample data from github
Now let’s download the data.
# dl the first dataset from the sample data repository
Path2Data <- MoveR::DLsampleData(dataSet = 1, tracker = "TRex")

Path2Data
## [1] "C:\\Users\\quent\\AppData\\Local\\Temp\\Rtmpwb0XWn\\MoveR_SampleData-main\\sample_1\\TRexOutput"
## [2] "C:\\Users\\quent\\AppData\\Local\\Temp\\Rtmpwb0XWn\\MoveR_SampleData-main\\sample_1\\ReferenceData\\DistMatrixFromArenaEdge_2602_ISA3080_Low_5.mov_1800.txt"
## [3] "C:\\Users\\quent\\AppData\\Local\\Temp\\Rtmpwb0XWn\\MoveR_SampleData-main\\sample_1\\ReferenceData\\RefDat_2602_ISA3080_Low_5.csv"The function download the data from the MoveR_SampleData github repository and returns a vector containing the path to the raw data and the distance matrix helping to locate the edge of the arena and the reference data corresponding to the location particles (manually detected) over several frames (the laters will be useful in another tutorial).
Note that by default the function are saving the sample data within a temporary directory that is deleted when the R session is terminated properly. User can also specify another directory using the dir argument from DLsampleData(). In any case, the function look for previous occurrence of the sample data to avoid multiple downloading.
Import sample data into R environment
Once the sample data has been downloaded or retrieved we use readTrex() to import the data into environment.
Note that the same result can be achieved trough the use of readAnimalTA(), readCtrax(), readIdtracker(), readPlain() or readTrackR() depending on the input data. Accordingly, make sure to select the read function that corresponds to the chosen example dataset or to your own input data.
Here the raw tracking data are located in the ./MoveR_SampleData-main/sample_1/TREXOutput directory which is the first element of the Path2Data vector.
# Import the sample data
trackdat <-
  MoveR::readTrex(Path2Data[[1]])

# check the class, number of tracklets and their id
class(trackdat)
## [1] "tracklets"
length(trackdat)## [1] 13
names(trackdat)## [1] "0" "1" "2" "3" "4" "5" "6" "7" "8" "9" "10" "11" "12"
# display the data for the first particle only
str(trackdat[[1]])
## 'data.frame': 12013 obs. of 7 variables:
## $ maj.ax : num 23.5 23.9 21.6 23.2 21.5 ...
## $ angle : num -0.733 -0.767 -0.761 -0.896 -0.88 ...
## $ min.ax : num NA NA NA NA NA NA NA NA NA NA ...
## $ x.pos : num 2278 2273 2269 2268 2267 ...
## $ y.pos : num 633 638 641 645 646 ...
## $ identity: num 0 0 0 0 0 0 0 0 0 0 ...
## $ frame : num 0 1 2 3 4 5 6 7 8 9 ...The function import the data as an object of class “tracklets”, a list of tracklets (data frame) numbered according to the identity specified by the tracking software and containing 7 elements classically used for further computations using the MoveR package.
Note that, by default, the output of the various read functions is standardized. However, it is also possible to import other elements that are specific to the tracking software used by specifying rawDat = TRUE.
# Import the sample data
trackdatFull <-
  MoveR::readTrex(Path2Data[[1]],
                  rawDat = TRUE)

# display the data for the first particle only
str(trackdatFull[[1]])
## 'data.frame': 12013 obs. of 35 variables:
## $ maj.ax : num 23.5 23.9 21.6 23.2 21.5 ...
## $ angle : num -0.733 -0.767 -0.761 -0.896 -0.88 ...
## $ min.ax : num NA NA NA NA NA NA NA NA NA NA ...
## $ x.pos : num 2278 2273 2269 2268 2267 ...
## $ y.pos : num 633 638 641 645 646 ...
## $ identity : num 0 0 0 0 0 0 0 0 0 0 ...
## $ frame : num 0 1 2 3 4 5 6 7 8 9 ...
## $ BORDER_DISTANCE.pcentroid: num 634 640 644 646 648 ...
## $ ACCELERATION.pcentroid : num 0 5716 1187 2206 139 ...
## $ ACCELERATION.wcentroid : num 0 4371 1425 2476 1215 ...
## $ SPEED.smooth.wcentroid : num 0 174.9 142.4 87.5 39.4 ...
## $ ANGULAR_A.centroid : num 0 4001.2 -4063.9 58 -68.1 ...
## $ ANGULAR_V.centroid : num 0 160.049 -2.506 -0.185 -2.909 ...
## $ normalized_midline : num -0.0717 0.145 0.1258 0.1932 -0.066 ...
## $ SPEED.wcentroid : num 0 174.9 142.4 87.5 39.4 ...
## $ SPEED.pcentroid : num 0 228.6 212.1 131.1 83.4 ...
## $ MIDLINE_OFFSET : num -0.0801 0.1628 0.1041 0.1977 -0.0543 ...
## $ midline_length : num 23.5 23.9 21.6 23.2 21.5 ...
## $ segment_length : num 2.13 2.17 1.96 2.11 1.96 ...
## $ X.wcentroid : num 2278 2273 2269 2268 2267 ...
## $ Y.wcentroid : num 633 638 641 645 646 ...
## $ num_pixels : num 173 171 174 186 169 163 172 196 193 205 ...
## $ midline_x : num 2286 2281 2275 2275 2274 ...
## $ midline_y : num 626 632 635 637 639 ...
## $ timestamp : num 0 40000 80000 120000 160000 200000 240000 280000 320000 360000 ...
## $ missing : num 0 0 0 0 0 0 0 0 0 0 ...
## $ ANGLE : num -0.733 -0.767 -0.761 -0.896 -0.88 ...
## $ SPEED : num 0 43.2 39 132.8 153.4 ...
## $ time : num 0 0.04 0.08 0.12 0.16 ...
## $ AX : num 0 997 3282 6059 3629 ...
## $ AY : num 0 414 -4185 -3220 -4406 ...
## $ VX : num 0 39.9 16.9 121.7 123.1 ...
## $ VY : num 0 16.6 -35.1 -53.2 -91.5 ...
## $ X : num 2285 2280 2274 2273 2273 ...
## $ Y : num 628 634 637 639 641 ...In this case, the function still returns an object of class “tracklets” but each tracklet now contains more information, according to the elements returned by the tracking software, here TRex (e.g., “BORDER_DISTANCE.pcentroid”, “ACCELERATION.pcentroid”, “ANGULAR_A.centroid”).
Also, the argument mirrorY, can be used to revert the y coordinates. Indeed some tracking software sets the origin of the y axis on the bottom-left while other use the upper-left corner of the video (see readTrex() for more insight).
Read and add some information to a tracklets object
Now that we have imported the tracking data, we either check or set some additional information about the tracking session that can be useful for further data processing. More especially, as the frame rate, the scale and the resolution of the video/image are used by several functions it is possible to encode them into the tracklets object using setInfo() or to access them using getInfo() as follow:
# check the additional information retrieved from the tracking output (depends on the tracking software used)
MoveR::getInfo(trackdat)
## $frameR
## [1] 25
##
## $scale
## NULL
##
## $imgRes
## NULL
# set the the image resolution, but not the scale as it will not be useful for this tutorial
trackdat <- MoveR::setInfo(trackdat, imgRes = c(3840, 2160))
As displayed, the frame rate (frameR) is automatically retrieved from the tracking output but this is not the case for the scale (scale) and the image resolution (imgRes). Accordingly, we can easily specify the image resolution using setInfo() but as the scale will not be useful in this section we can leave the slot empty.
Note that the MoveR package’s functions (e.g., speed(), drawTracklets()) using this additional information (i.e., frameR, scale, imgRes) will automatically retrieve them from the tracklets object, except if they are manually encoded in a given function, allowing to avoid unnecessary repetition of code.
Now we have imported the data as tracklets object, it is easy to look at the particles trajectories.
First look at the trajectories
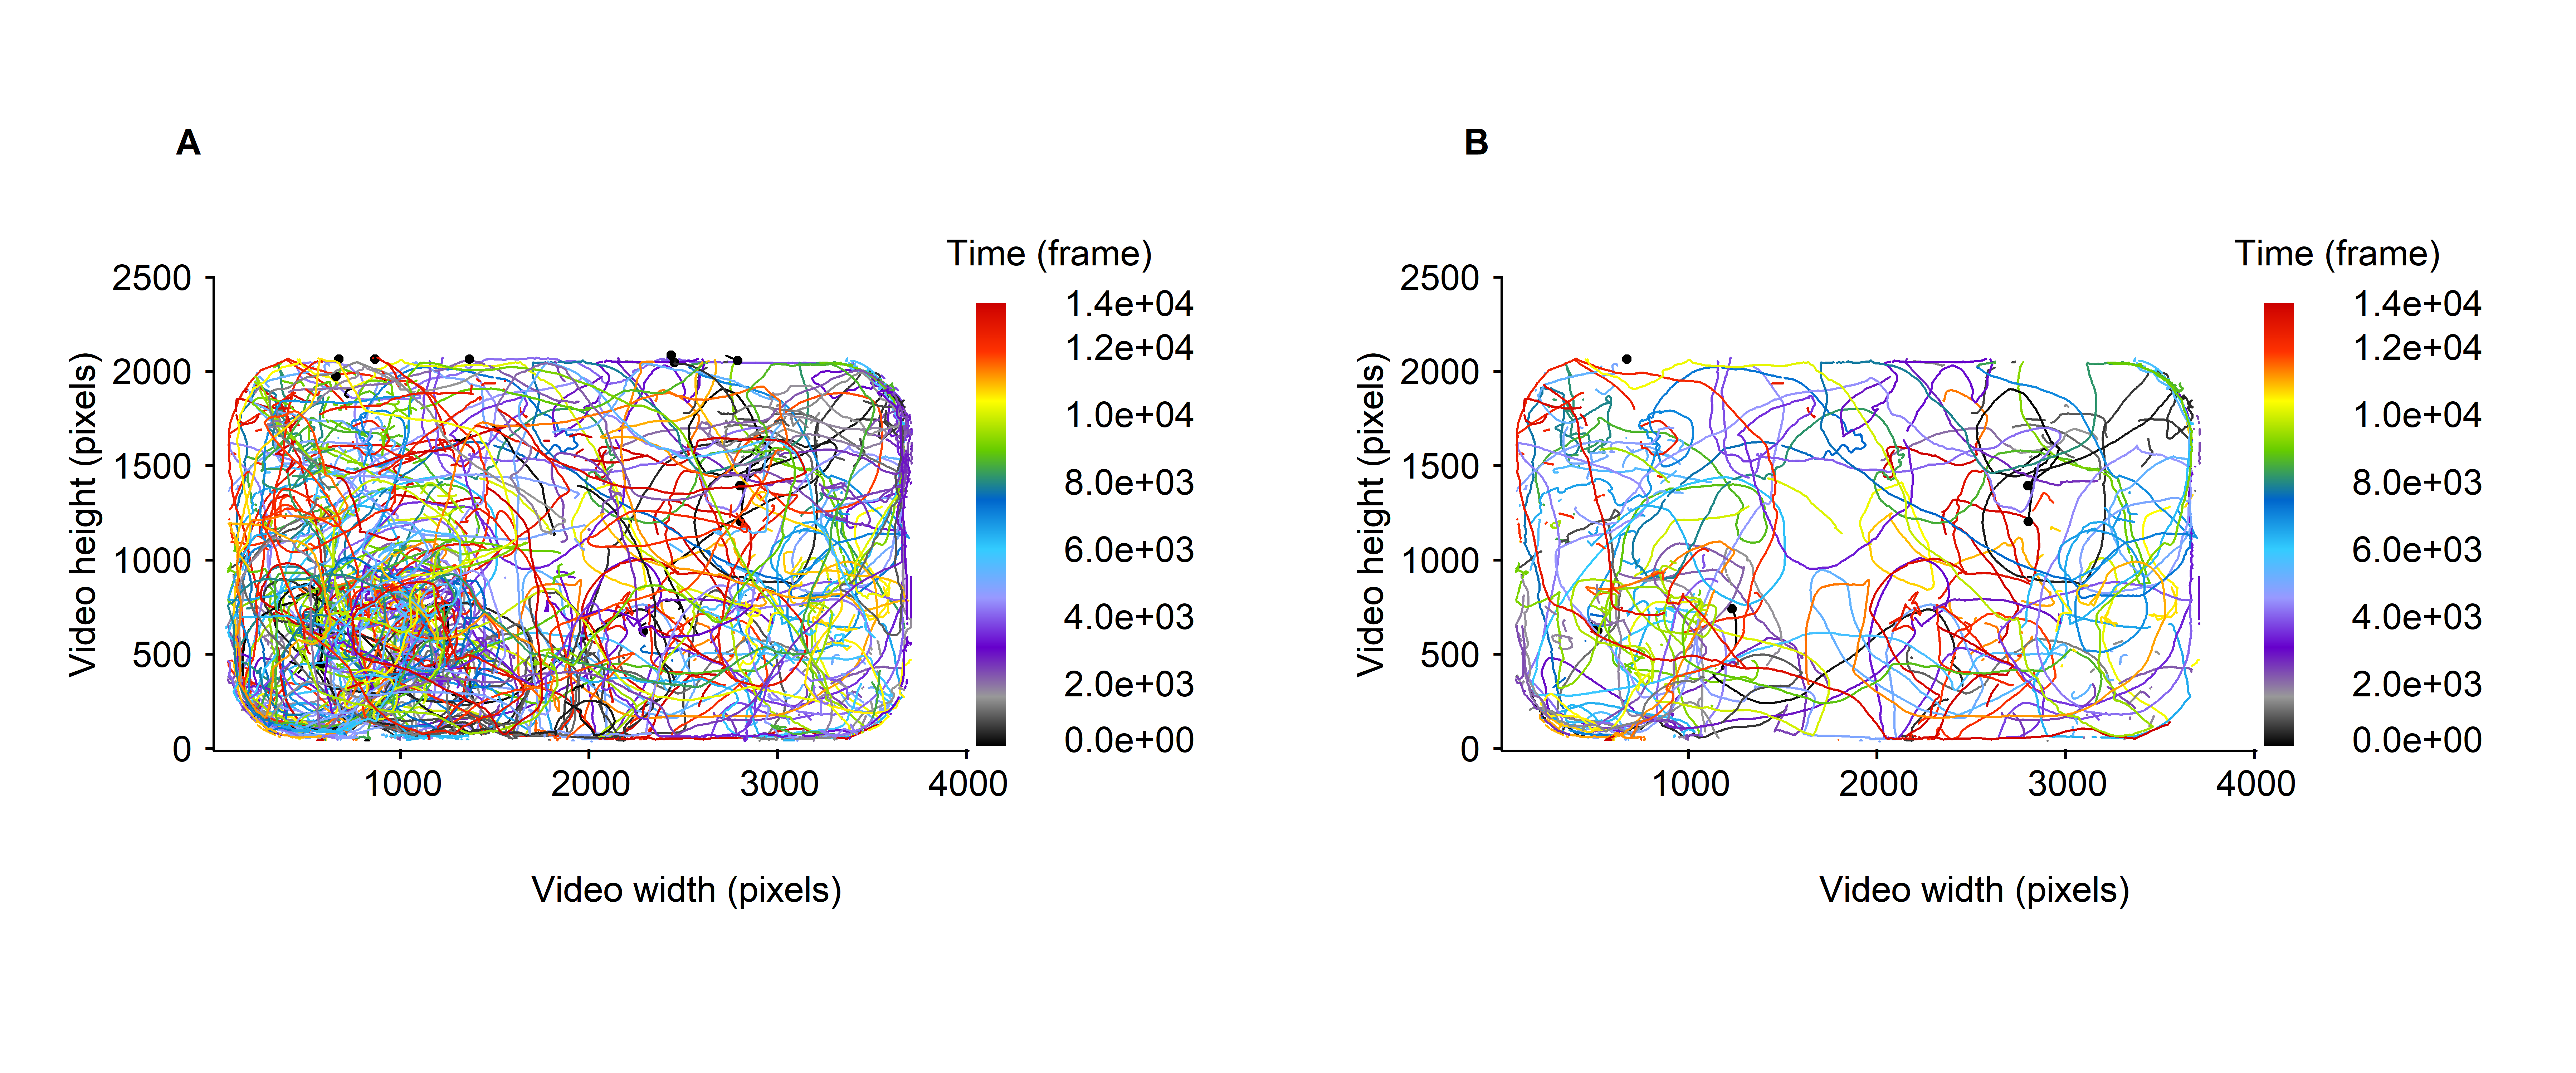
Using drawTracklets(), it is easy to visualize the trajectories included in the dataset (see fig. 2A below), or to focus on the trajectories described only by some particles, here the fifth’ first (see fig. 2B below).
Note that drawTracklets() needs an argument timeCol specifying the timeline of the video (here “frame”, which is the default value). One can also specify the resolution of the video to set x and y limits of the plot either manually or once for all trough setInfo() (see above) but in case neither of this option has been chosen, the imgRes argument use the maximum values recorded in x and y + 5% to set the plots limits (see drawTracklets() documentation).
# split the graphical window in 2 columns
par(mfrow = c(1, 2))

# draw the trajectories of all particles
MoveR::drawTracklets(trackdat)

# add a letter identifying the plot to the upper left corner of the first plot
mtext(
  substitute(paste(bold("A"))),
  side = 3,
  line = 0,
  adj = 0,
  padj = -0.5
)

# draw the trajectories only for the first five particles
MoveR::drawTracklets(
  trackdat,
  selTrack = c(1:5)
)

# add a letter identifying the plot to the upper left corner of the second plot
mtext(
  substitute(paste(bold("B"))),
  side = 3,
  line = 0,
  adj = 0,
  padj = -0.5
)
Figure 2: Micro-wasps trajectories over the whole video timeline, expressed in frame. A. all trajectories are represented. B. only the first 5 tracklets are represented. The trajectories are colored according to the moments at which they are recorded.
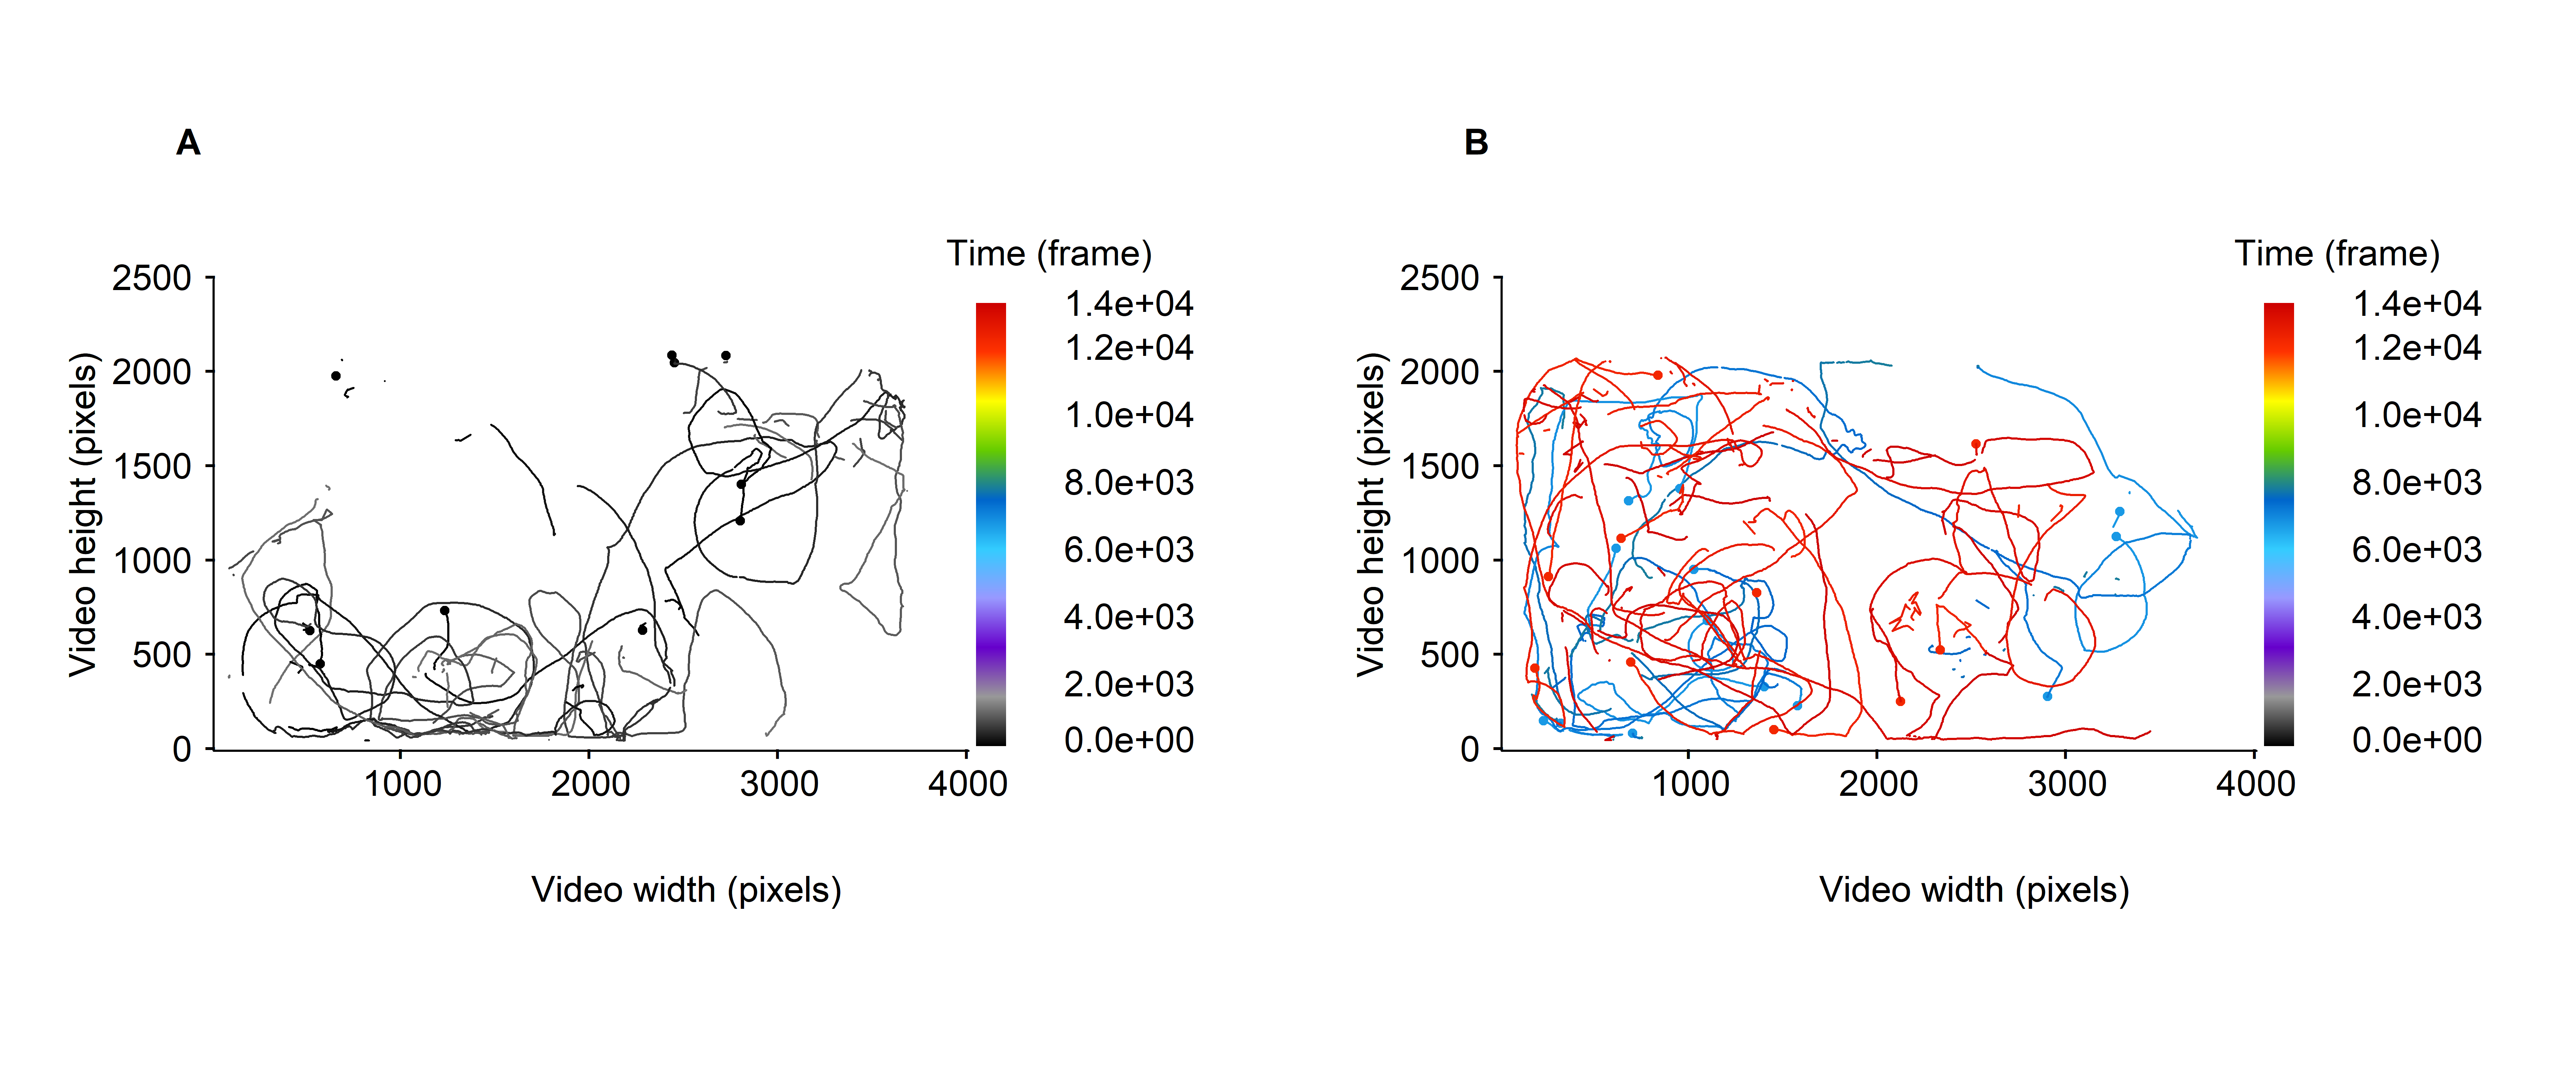
Otherwise, it is possible to focus on the trajectories recorded within a given time intervals. For instance, between 1 and 999 frames (see fig. 3A below) and between 6000 and 6999 frames and 11000, 11999 frames (see fig. 3B below).
# split the graphical window in 2 columns
par(mfrow=c(1,2))

# draw the trajectories over a time window of 1000 frames (between 1 and 999 frames)
MoveR::drawTracklets(
  trackdat,
  timeWin = list(c(1, 999))
)

# add a letter identifying the plot to the upper left corner of the first plot
mtext(substitute(paste(bold("A"))), side = 3, line = 0, adj = 0, padj = -0.5)

# draw the trajectories over two time windows of 1000 frames (between 6000 and 6999 and 11000 and 11999 frames)
MoveR::drawTracklets(
  trackdat,
  timeWin = list(c(6000, 6999), c(11000, 11999))
  )

# add a letter identifying the plot to the upper left corner of the second plot
mtext(substitute(paste(bold("B"))), side = 3, line = 0, adj = 0, padj = -0.5)
Figure 3: Micro-wasps trajectories over specified part of the video timeline, expressed in frame. A. all trajectories are represented over a time window of 1000 frames (between 1 and 999 frames). B. all trajectories are represented over two time windows of 1000 frames duration (between 6000 and 6999 and 11000 and 11999 frames). The trajectories are colored according to the moments at which they are recorded.
Note that it is also possible to represent specified tracklets over given time window(s) by combining the selFrags and timeWin arguments respectively. Also, more examples of what can be displayed using drawTracklets are available on the drawTracklets documentation page
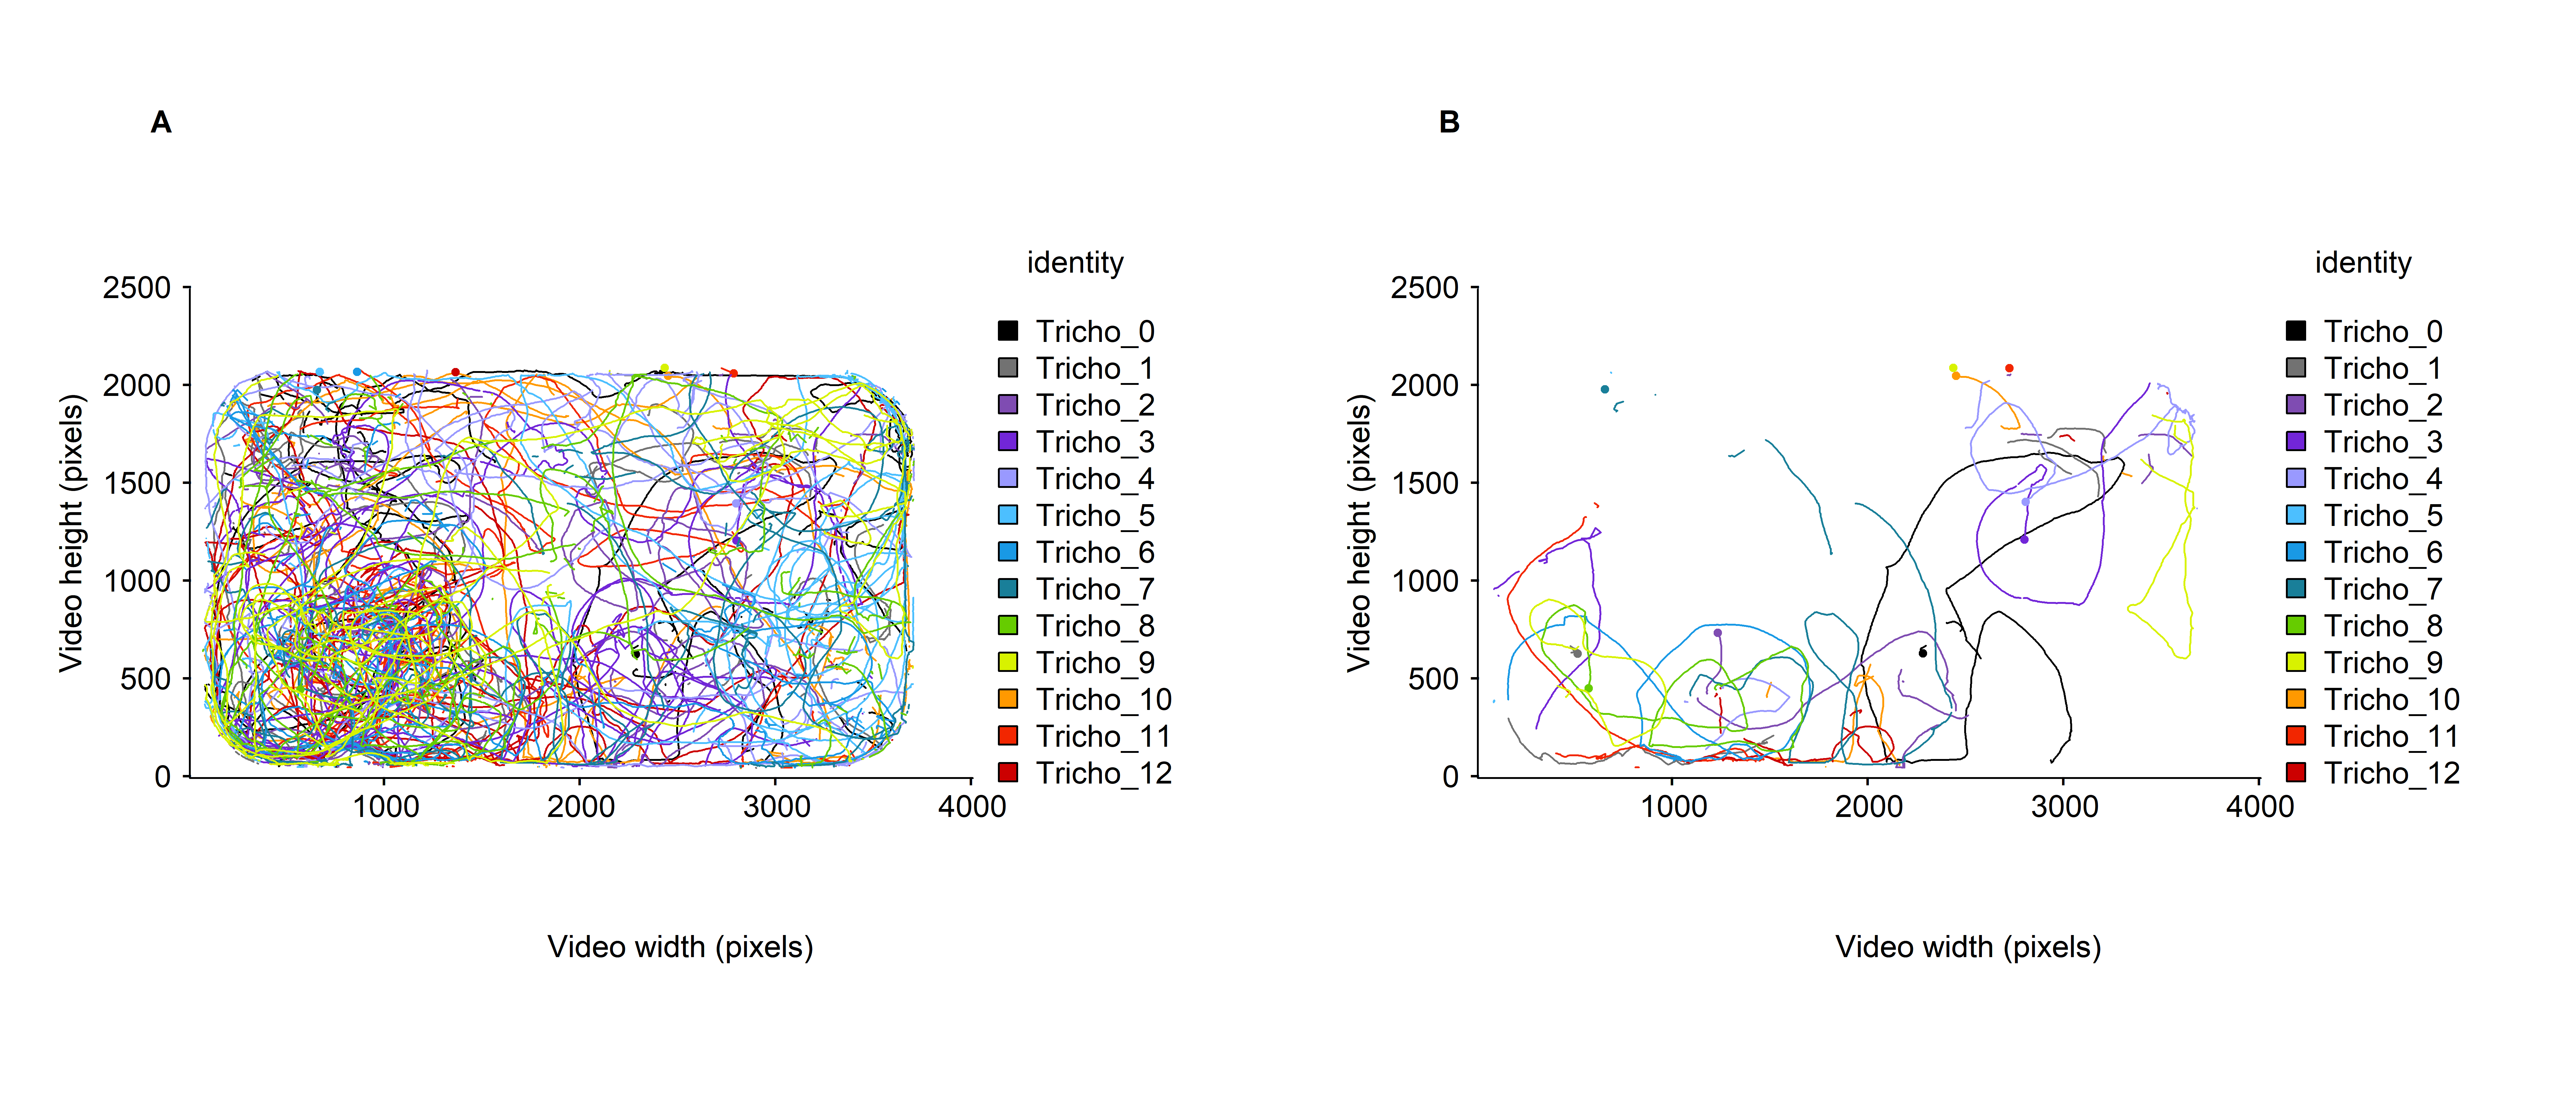
Finally, drawTracklets allow to color the particles’ tracks according to categorical variable, such as the identity of the particle (see fig. 4A below).
However, here the identity of the particles is a numerical variable, we hence need to convert it to a factor, for instance by appending “Tricho” (i.e., part of the micro-wasps genus name) in front of each id. For this purpose, the easiest way is to use the “convert2List” function, transform the identity variable then convert back the data as a list of tracklets using convert2Tracklets as follow:
trackdatList <- MoveR::convert2List(trackdat)
trackdatList[["identity"]] <- paste("Tricho", trackdatList[["identity"]], sep = "_")
trackdat <- MoveR::convert2Tracklets(trackdatList, by = "identity")

str(trackdat)
## List of 13
## $ Tricho_0 :'data.frame': 12013 obs. of 8 variables:
## ..$ maj.ax : num [1:12013] 23.5 23.9 21.6 23.2 21.5 ...
## ..$ angle : num [1:12013] -0.733 -0.767 -0.761 -0.896 -0.88 ...
## ..$ min.ax : num [1:12013] NA NA NA NA NA NA NA NA NA NA ...
## ..$ x.pos : num [1:12013] 2278 2273 2269 2268 2267 ...
## ..$ y.pos : num [1:12013] 633 638 641 645 646 ...
## ..$ identity : chr [1:12013] "Tricho_0" "Tricho_0" "Tricho_0" "Tricho_0" ...
## ..$ frame : num [1:12013] 0 1 2 3 4 5 6 7 8 9 ...
## ..$ trackletId: chr [1:12013] "0" "0" "0" "0" ...
## $ Tricho_1 :'data.frame': 12024 obs. of 8 variables:
## ..$ maj.ax : num [1:12024] 30.9 31.1 30 22.7 29.8 ...
## ..$ angle : num [1:12024] 1.98 2.063 2.236 -0.942 2.328 ...
## ..$ min.ax : num [1:12024] NA NA NA NA NA NA NA NA NA NA ...
## ..$ x.pos : num [1:12024] 509 509 508 506 508 ...
## ..$ y.pos : num [1:12024] 636 636 635 637 635 ...
## ..$ identity : chr [1:12024] "Tricho_1" "Tricho_1" "Tricho_1" "Tricho_1" ...
## ..$ frame : num [1:12024] 0 1 2 3 4 5 6 7 8 9 ...
## ..$ trackletId: chr [1:12024] "1" "1" "1" "1" ...
## $ Tricho_10:'data.frame': 12024 obs. of 8 variables:
## ..$ maj.ax : num [1:12024] 18.6 19.4 19.2 19.6 19.3 ...
## ..$ angle : num [1:12024] 0.591 0.589 0.462 0.588 0.482 ...
## ..$ min.ax : num [1:12024] NA NA NA NA NA NA NA NA NA NA ...
## ..$ x.pos : num [1:12024] 2442 2442 2442 2442 2442 ...
## ..$ y.pos : num [1:12024] 2057 2056 2056 2056 2055 ...
## ..$ identity : chr [1:12024] "Tricho_10" "Tricho_10" "Tricho_10" "Tricho_10" ...
## ..$ frame : num [1:12024] 0 1 2 3 4 5 6 7 8 9 ...
## ..$ trackletId: chr [1:12024] "10" "10" "10" "10" ...
## $ Tricho_11:'data.frame': 12024 obs. of 8 variables:
## ..$ maj.ax : num [1:12024] 21.9 84.1 Inf Inf Inf ...
## ..$ angle : num [1:12024] 0.088962 0.000169 Inf Inf Inf ...
## ..$ min.ax : num [1:12024] NA NA NA NA NA NA NA NA NA NA ...
## ..$ x.pos : num [1:12024] 2778 2715 Inf Inf Inf ...
## ..$ y.pos : num [1:12024] 2069 2095 Inf Inf Inf ...
## ..$ identity : chr [1:12024] "Tricho_11" "Tricho_11" "Tricho_11" "Tricho_11" ...
## ..$ frame : num [1:12024] 0 1 2 3 4 5 6 7 8 9 ...
## ..$ trackletId: chr [1:12024] "11" "11" "11" "11" ...
## $ Tricho_12:'data.frame': 12024 obs. of 8 variables:
## ..$ maj.ax : num [1:12024] 80.5 Inf Inf Inf Inf ...
## ..$ angle : num [1:12024] 0.000184 Inf Inf Inf Inf ...
## ..$ min.ax : num [1:12024] NA NA NA NA NA NA NA NA NA NA ...
## ..$ x.pos : num [1:12024] 1356 Inf Inf Inf Inf ...
## ..$ y.pos : num [1:12024] 2075 Inf Inf Inf Inf ...
## ..$ identity : chr [1:12024] "Tricho_12" "Tricho_12" "Tricho_12" "Tricho_12" ...
## ..$ frame : num [1:12024] 0 1 2 3 4 5 6 7 8 9 ...
## ..$ trackletId: chr [1:12024] "12" "12" "12" "12" ...
## $ Tricho_2 :'data.frame': 12014 obs. of 8 variables:
## ..$ maj.ax : num [1:12014] 23.5 20.8 20.1 19.6 19.3 ...
## ..$ angle : num [1:12014] -1.07 2.02 1.98 1.83 1.85 ...
## ..$ min.ax : num [1:12014] NA NA NA NA NA NA NA NA NA NA ...
## ..$ x.pos : num [1:12014] 1221 1225 1229 1232 1235 ...
## ..$ y.pos : num [1:12014] 752 743 734 726 717 ...
## ..$ identity : chr [1:12014] "Tricho_2" "Tricho_2" "Tricho_2" "Tricho_2" ...
## ..$ frame : num [1:12014] 0 1 2 3 4 5 6 7 8 9 ...
## ..$ trackletId: chr [1:12014] "2" "2" "2" "2" ...
## $ Tricho_3 :'data.frame': 12024 obs. of 8 variables:
## ..$ maj.ax : num [1:12024] 20.5 21 19.2 20.2 20 ...
## ..$ angle : num [1:12024] -1.64 1.47 1.54 1.43 1.46 ...
## ..$ min.ax : num [1:12024] NA NA NA NA NA NA NA NA NA NA ...
## ..$ x.pos : num [1:12024] 2791 2792 2793 2793 2794 ...
## ..$ y.pos : num [1:12024] 1215 1219 1223 1228 1232 ...
## ..$ identity : chr [1:12024] "Tricho_3" "Tricho_3" "Tricho_3" "Tricho_3" ...
## ..$ frame : num [1:12024] 0 1 2 3 4 5 6 7 8 9 ...
## ..$ trackletId: chr [1:12024] "3" "3" "3" "3" ...
## $ Tricho_4 :'data.frame': 12024 obs. of 8 variables:
## ..$ maj.ax : num [1:12024] 26 20 20 20.6 20.1 ...
## ..$ angle : num [1:12024] 0.514 0.636 0.789 0.663 0.534 ...
## ..$ min.ax : num [1:12024] NA NA NA NA NA NA NA NA NA NA ...
## ..$ x.pos : num [1:12024] 2790 2797 2802 2809 2818 ...
## ..$ y.pos : num [1:12024] 1404 1413 1421 1425 1429 ...
## ..$ identity : chr [1:12024] "Tricho_4" "Tricho_4" "Tricho_4" "Tricho_4" ...
## ..$ frame : num [1:12024] 0 1 2 3 4 5 6 7 8 9 ...
## ..$ trackletId: chr [1:12024] "4" "4" "4" "4" ...
## $ Tricho_5 :'data.frame': 12024 obs. of 8 variables:
## ..$ maj.ax : num [1:12024] Inf Inf Inf Inf Inf ...
## ..$ angle : num [1:12024] Inf Inf Inf Inf Inf ...
## ..$ min.ax : num [1:12024] NA NA NA NA NA NA NA NA NA NA ...
## ..$ x.pos : num [1:12024] 662 Inf Inf Inf Inf ...
## ..$ y.pos : num [1:12024] 2076 Inf Inf Inf Inf ...
## ..$ identity : chr [1:12024] "Tricho_5" "Tricho_5" "Tricho_5" "Tricho_5" ...
## ..$ frame : num [1:12024] 0 1 2 3 4 5 6 7 8 9 ...
## ..$ trackletId: chr [1:12024] "5" "5" "5" "5" ...
## $ Tricho_6 :'data.frame': 12024 obs. of 8 variables:
## ..$ maj.ax : num [1:12024] Inf Inf Inf Inf Inf ...
## ..$ angle : num [1:12024] Inf Inf Inf Inf Inf ...
## ..$ min.ax : num [1:12024] NA NA NA NA NA NA NA NA NA NA ...
## ..$ x.pos : num [1:12024] 854 Inf Inf Inf Inf ...
## ..$ y.pos : num [1:12024] 2076 Inf Inf Inf Inf ...
## ..$ identity : chr [1:12024] "Tricho_6" "Tricho_6" "Tricho_6" "Tricho_6" ...
## ..$ frame : num [1:12024] 0 1 2 3 4 5 6 7 8 9 ...
## ..$ trackletId: chr [1:12024] "6" "6" "6" "6" ...
## $ Tricho_7 :'data.frame': 12024 obs. of 8 variables:
## ..$ maj.ax : num [1:12024] 21 23.4 24.8 23 24.2 ...
## ..$ angle : num [1:12024] 2.02 -1.34 -1.52 -1.58 -1.65 ...
## ..$ min.ax : num [1:12024] NA NA NA NA NA NA NA NA NA NA ...
## ..$ x.pos : num [1:12024] 648 649 649 650 650 ...
## ..$ y.pos : num [1:12024] 1985 1987 1991 1993 1995 ...
## ..$ identity : chr [1:12024] "Tricho_7" "Tricho_7" "Tricho_7" "Tricho_7" ...
## ..$ frame : num [1:12024] 0 1 2 3 4 5 6 7 8 9 ...
## ..$ trackletId: chr [1:12024] "7" "7" "7" "7" ...
## $ Tricho_8 :'data.frame': 12024 obs. of 8 variables:
## ..$ maj.ax : num [1:12024] 16.5 17.8 26.2 23.7 17.2 ...
## ..$ angle : num [1:12024] 1.26 1.09 -1.73 1.18 1.17 ...
## ..$ min.ax : num [1:12024] NA NA NA NA NA NA NA NA NA NA ...
## ..$ x.pos : num [1:12024] 564 565 564 565 566 ...
## ..$ y.pos : num [1:12024] 452 459 466 471 479 ...
## ..$ identity : chr [1:12024] "Tricho_8" "Tricho_8" "Tricho_8" "Tricho_8" ...
## ..$ frame : num [1:12024] 0 1 2 3 4 5 6 7 8 9 ...
## ..$ trackletId: chr [1:12024] "8" "8" "8" "8" ...
## $ Tricho_9 :'data.frame': 12024 obs. of 8 variables:
## ..$ maj.ax : num [1:12024] 51.7 44.5 Inf Inf Inf ...
## ..$ angle : num [1:12024] 0.000424 0.000558 Inf Inf Inf ...
## ..$ min.ax : num [1:12024] NA NA NA NA NA NA NA NA NA NA ...
## ..$ x.pos : num [1:12024] 2425 2429 Inf Inf Inf ...
## ..$ y.pos : num [1:12024] 2097 2097 Inf Inf Inf ...
## ..$ identity : chr [1:12024] "Tricho_9" "Tricho_9" "Tricho_9" "Tricho_9" ...
## ..$ frame : num [1:12024] 0 1 2 3 4 5 6 7 8 9 ...
## ..$ trackletId: chr [1:12024] "9" "9" "9" "9" ...
## - attr(*, "class")= chr "tracklets"
## - attr(*, "frameR")= num 25
## - attr(*, "imgRes")= num [1:2] 3840 2160As previously noted, the various arguments from drawTracklets() can be combined to emphasize the behavior of particular tracklets over a specified time window (see fig. 4B below).
drawTracklets() also have various arguments helping to customize the graphical representation, see the function documentation for further information.
# split the graphical window in 2 columns
par(mfrow=c(1,2))

# draw the trajectories over the whole video timeline and color it according to particles' identity
MoveR::drawTracklets(
  trackdat,
  colId = "identity"
)

# add a letter identifying the plot to the upper left corner of the first plot
mtext(substitute(paste(bold("A"))), side = 3, line = 0, adj = 0, padj = -0.5)

# draw the trajectories over two time windows of 1000 frames (between 6000 and 6999 and 11000 and 11999 frames)
MoveR::drawTracklets(
  trackdat,
  timeWin = list(c(1, 999)),
  colId = "identity"
)

# add a letter identifying the plot to the upper left corner of the second plot
mtext(substitute(paste(bold("B"))), side = 3, line = 0, adj = 0, padj = -0.5)
Figure 4: Micro-wasps trajectories A. over the whole video timeline, and B. over a time window of 1000 frames (between 1 and 999 frames). Here the trajectories are colored according to the identity of the particle.
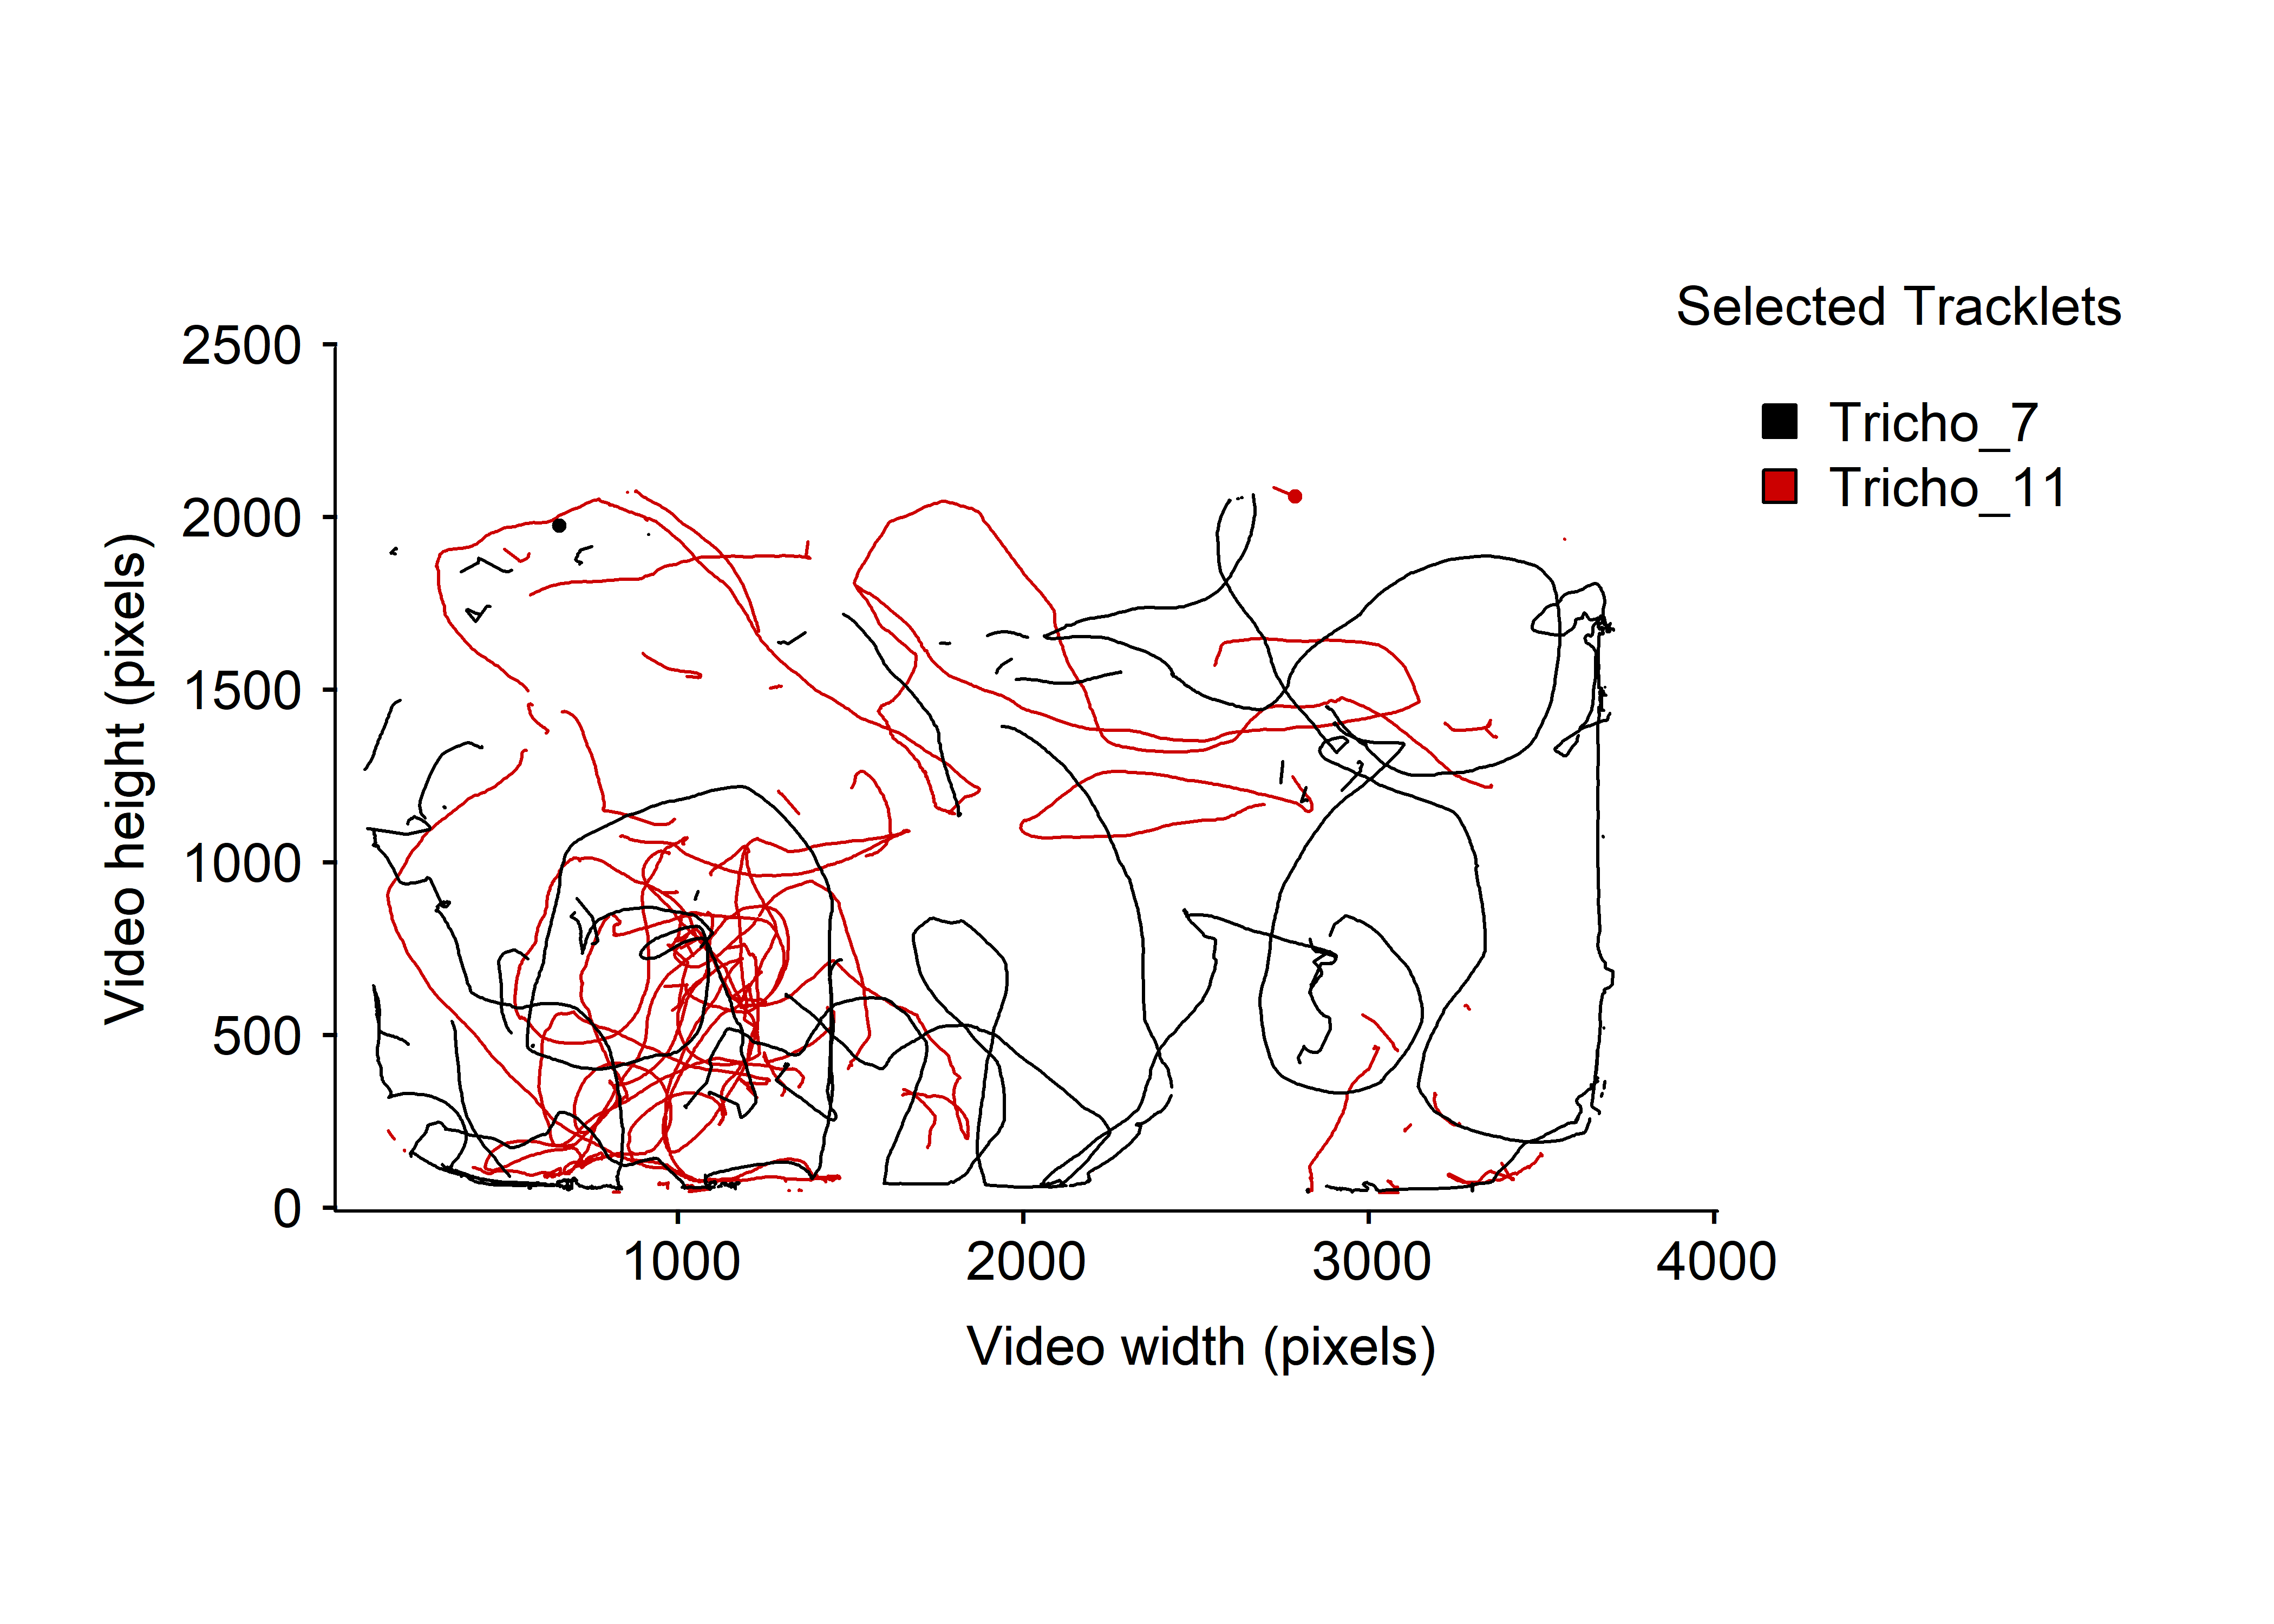
By looking at the fig. 4B, we can see that some particles’ tracks are interrupted. This is particularly obvious for Tricho_7 or Tricho_11, let’s take a closer look.
# restore the graphical window as default
par(mfrow=c(1,1))

# draw the selected tracklets over the whole video timeline and color it according to tracklets
MoveR::drawTracklets(
  trackdat,
  colId = "selTrack",
  selTrack = c("Tricho_7","Tricho_11")
)
Figure 5: Micro-wasps trajectories for Tricho_7 and Tricho_11 over the whole video timeline.
Indeed, on the fig. 5 the track of these two individuals are clearly interrupted at multiple location. It indicate that the tracking software have lost or perhaps switched the identity of some animals over the tracking session. The dataset hence need to cleaned/filtered to remove as much artifacts as possible.
For more insight how to use MoveR to clean and filter your dataset and then run further computation check the next tutorials.
Happy coding.
References
- Walter, T., Couzin, I.D., 2021. TRex, a fast multi-animal tracking system with markerless identification, and 2D estimation of posture and visual fields. eLife 10, e64000. https://doi.org/10.7554/eLife.64000