Given an object of class "tracklets" containing a list of tracklets, this function returns a plot with tracklets represented as a sequence of segments connecting cartesian coordinates between successive frames.
Usage
drawTracklets(
  trackDat,
  selTrack = NULL,
  selId = NULL,
  imgRes = c(NA, NA),
  timeWin = list(c(0, Inf)),
  timeCol = "frame",
  colGrad = c("#000000", "#999999", "#6600CC", "#9999FF", "#33CCFF", "#0066CC",
    "#66CC00", "#FFFF00", "#FF3300", "#CC0000"),
  alpha = 1,
  colId = NULL,
  add2It = NULL,
  srt = 0,
  lwd = 1,
  main = "",
  xlab = "Video width (pixels)",
  ylab = "Video height (pixels)",
  axLabPos = c(0, 2),
  legend = TRUE,
  legend.title = NULL,
  cex.axis = 1,
  cex.main = 1.25,
  cex.lab = 1,
  cex.leg = 1,
  ncol.leg = 1,
  cex.start = 0.5,
  asp = 1,
  progress = TRUE
)
Arguments
- trackDat
An object of class "tracklets" containing a list of tracklets and their characteristics classically used for further computations (at least x.pos, y.pos, frame).
- selTrack
A vector containing the id of the tracklets to plot (optional).
- selId
A vector containing the id of the particles to plot. Specifying selId result in displaying all tracklets belonging to the selected particles. Note that particles' identity is retrieved from the "identity" column (optional).
- imgRes
A vector of 2 numeric values, the resolution of the video used as x and y limit of the plot (i.e., the number of pixels in image width and height). If imgRes is unspecified, the function try to retrieve it from tracklets object attribute or approximate it using x and y maximum values + 5%.
- timeWin
A list of one or several vector containing 2 numeric values separated by a comma corresponding to the time interval between which tracklets have to be drawn in frame (optional).
- timeCol
A character string corresponding to the name of the column containing time information (default = "frame").
- colGrad
A vector of a ready to use color ramp or several colors specified either with their name or hexadecimal values (optional).
- alpha
A numeric value modifying the opacity alpha of the colors; typically in 0,1 (optional).
- colId
A character string corresponding to a column name present within each tracklet's data frame from the trackDat list and which is used as grouping factor to color the tracklets (default = timeCol). It is possible to specify "tracklets", "selTrack" or "selId" to color tracklets according to tracklets' id, or selected tracklets and particles' id respectively. Note that if colId is made of continuous values, the legend is plotted as a gradient (except if colId = "selTrack" or "selId").
- add2It
A function specifying element(s) to add to the plot.
- srt
A value or a vector of two values specifying the orientation of the axes values for the x and y axis respectively (default = 0).
- lwd
A numeric value, the line width of the tracklets (default = 1).
- main
Primary title of the plot (default = "").
- xlab
X-axis label (default = "Video width (pixels)").
- ylab
Y-axis label (default = "Video height (pixels)").
- axLabPos
A vector of two numeric values indicating on which margin line axis title (x, y respectively) should be, starting at 0 counting outwards (see
mtext).- legend
A logical value (i.e., TRUE or FALSE) indicating whether the legend should be displayed or not (default = TRUE).
- legend.title
The legend title.
- cex.axis
A numeric value, the character size and expansion for axis and legend values (default = 1).
- cex.main
A numeric value, the character size and expansion for primary title (default = 1.25).
- cex.lab
A numeric value, the character size and expansion for axes label (default = 1).
- cex.leg
A numeric value, the character size and expansion for the legend label (default = 1).
- ncol.leg
A numeric value, the number of columns the legend should be displayed, only when colId is not continuous (default = 1)
- cex.start
A numeric value, the size of the dot representing the start of the tracklets (default = 0.5).
- asp
A numeric value, the y/x aspect ratio of the plot window (see
plot.window).- progress
A logical value (i.e., TRUE or FALSE) indicating whether a progress bar should be displayed to inform process progression (default = TRUE).
Examples
set.seed(2023)
# generate some dummy tracklets
## start to specify some parameters to generate tracklets
TrackN <- 40 # the number of tracklet to simulate
TrackL <-
1:1000 # the length of the tracklets or a sequence to randomly sample tracklet length
TrackList <-
MoveR::trackletsClass(stats::setNames(lapply(lapply(seq(TrackN), function(i)
trajr::TrajGenerate(sample(TrackL, 1), random = TRUE, fps = 1)), function(j) {
data.frame(
x.pos = j$x - min(j$x),
y.pos = j$y - min(j$y),
frame = j$time,
identity = paste("Id", sample(1:10,1, replace = T), sep = "_")
)
}), seq(TrackN)))
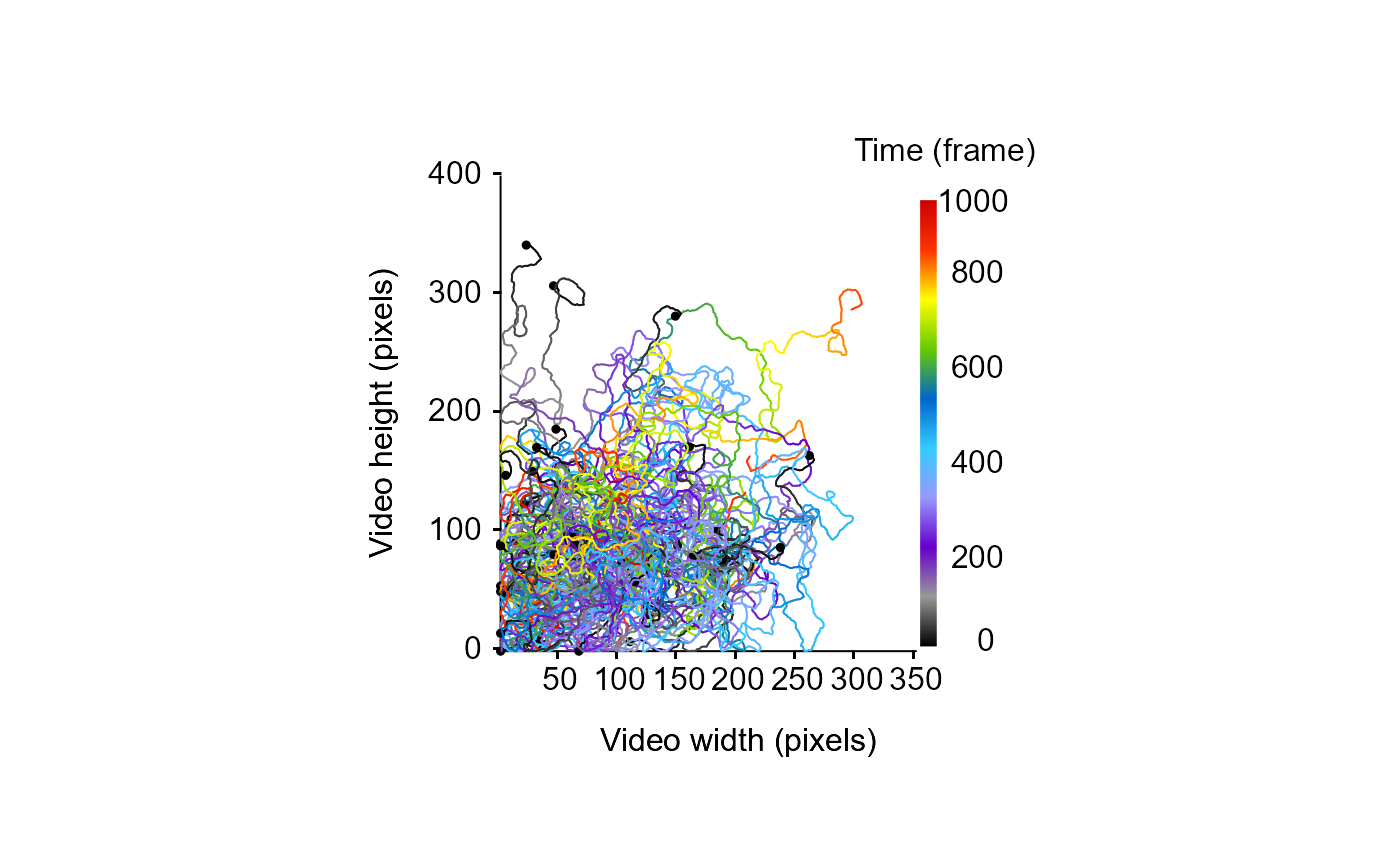
# example 1: draw all tracklets, for the whole video duration
MoveR::drawTracklets(TrackList,
axLabPos = c(1, -6))
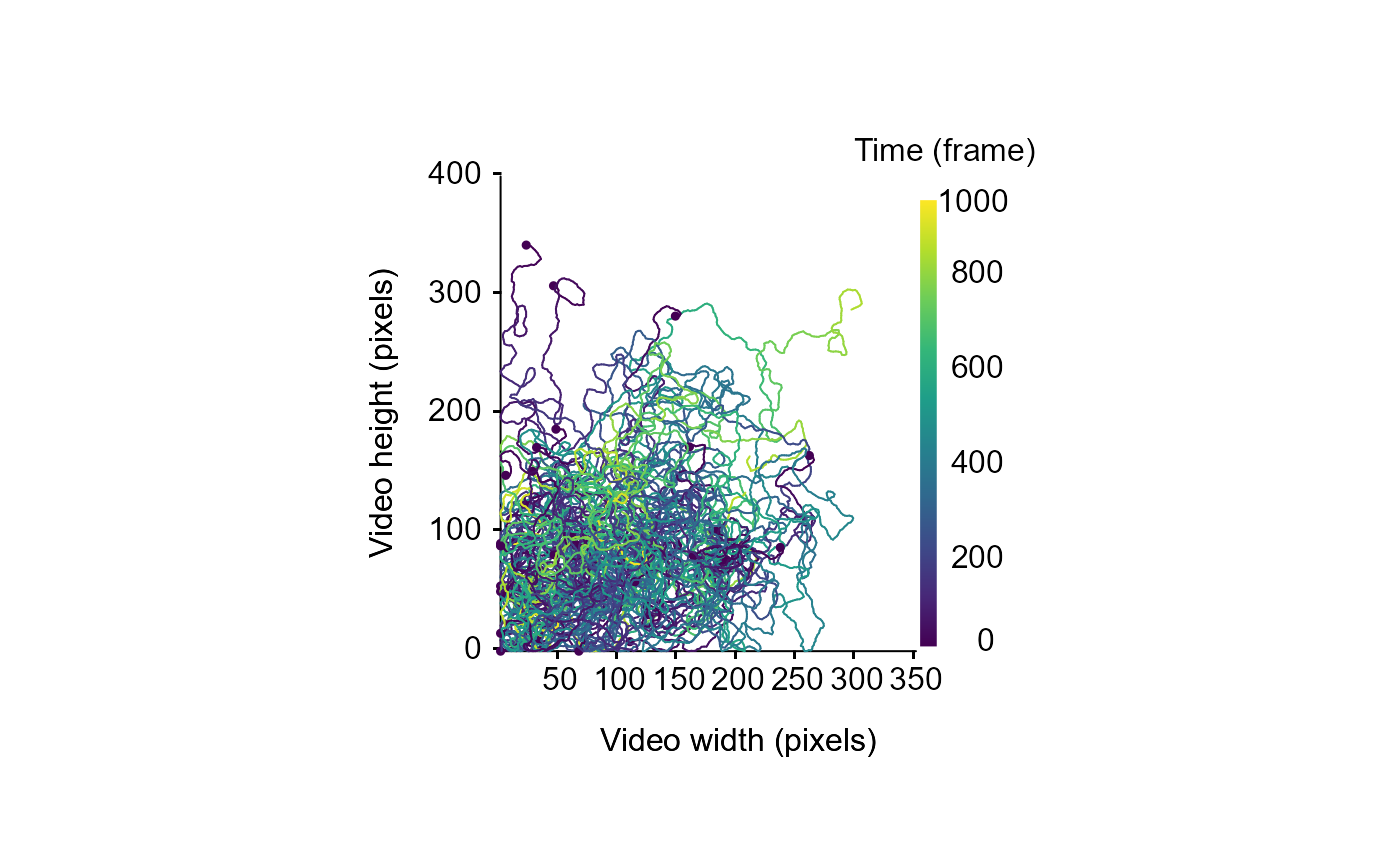
# example 1bis: draw all tracklets, for the whole video duration and change color gradient
MoveR::drawTracklets(TrackList,
colGrad = viridis::viridis(10),
axLabPos = c(1, -6))
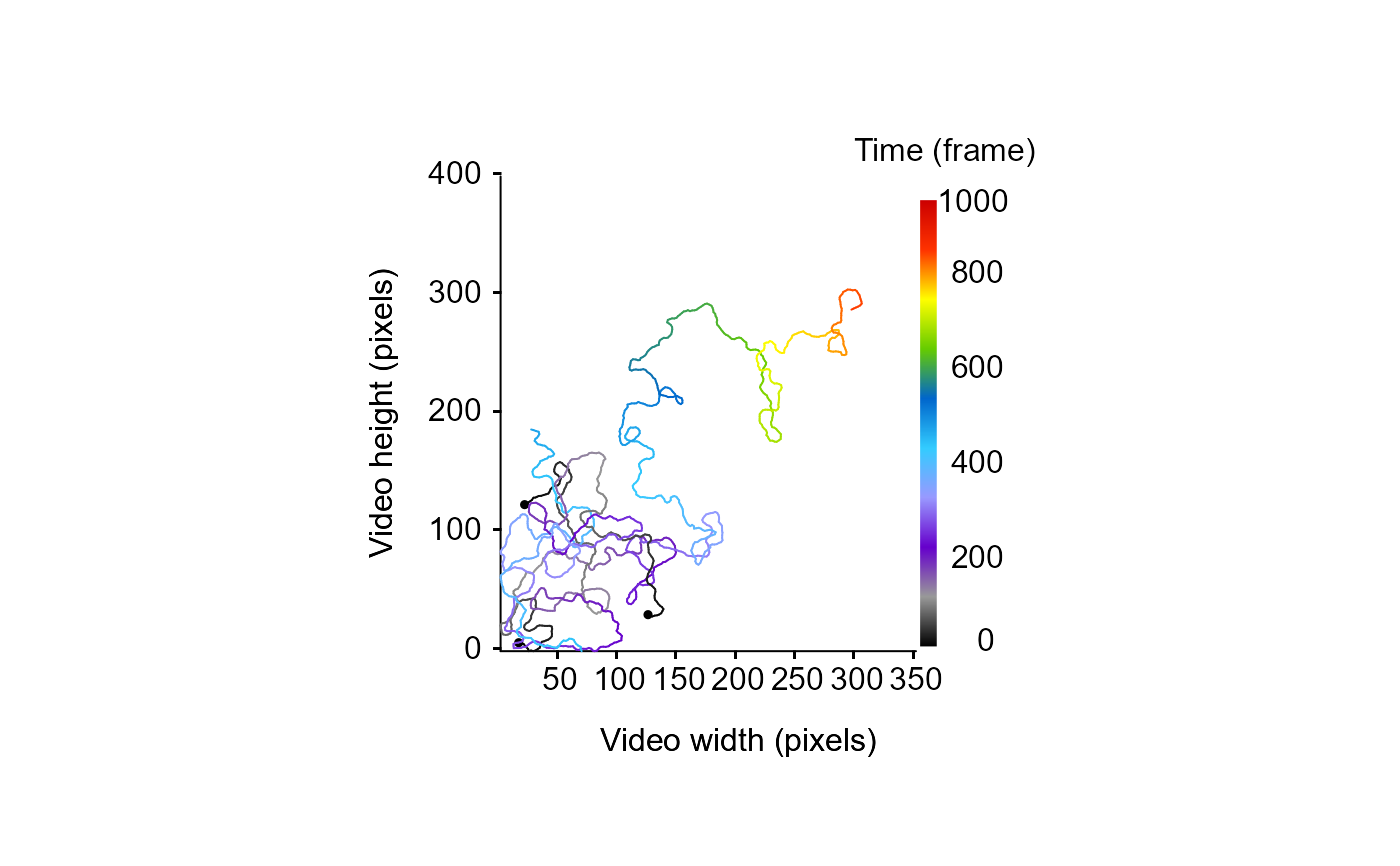
 # example 2: draw only selected tracklets (i.e., 1, 5 and 10), for the whole video duration
MoveR::drawTracklets(TrackList,
selTrack = c(1, 5, 10),
axLabPos = c(1, -6))
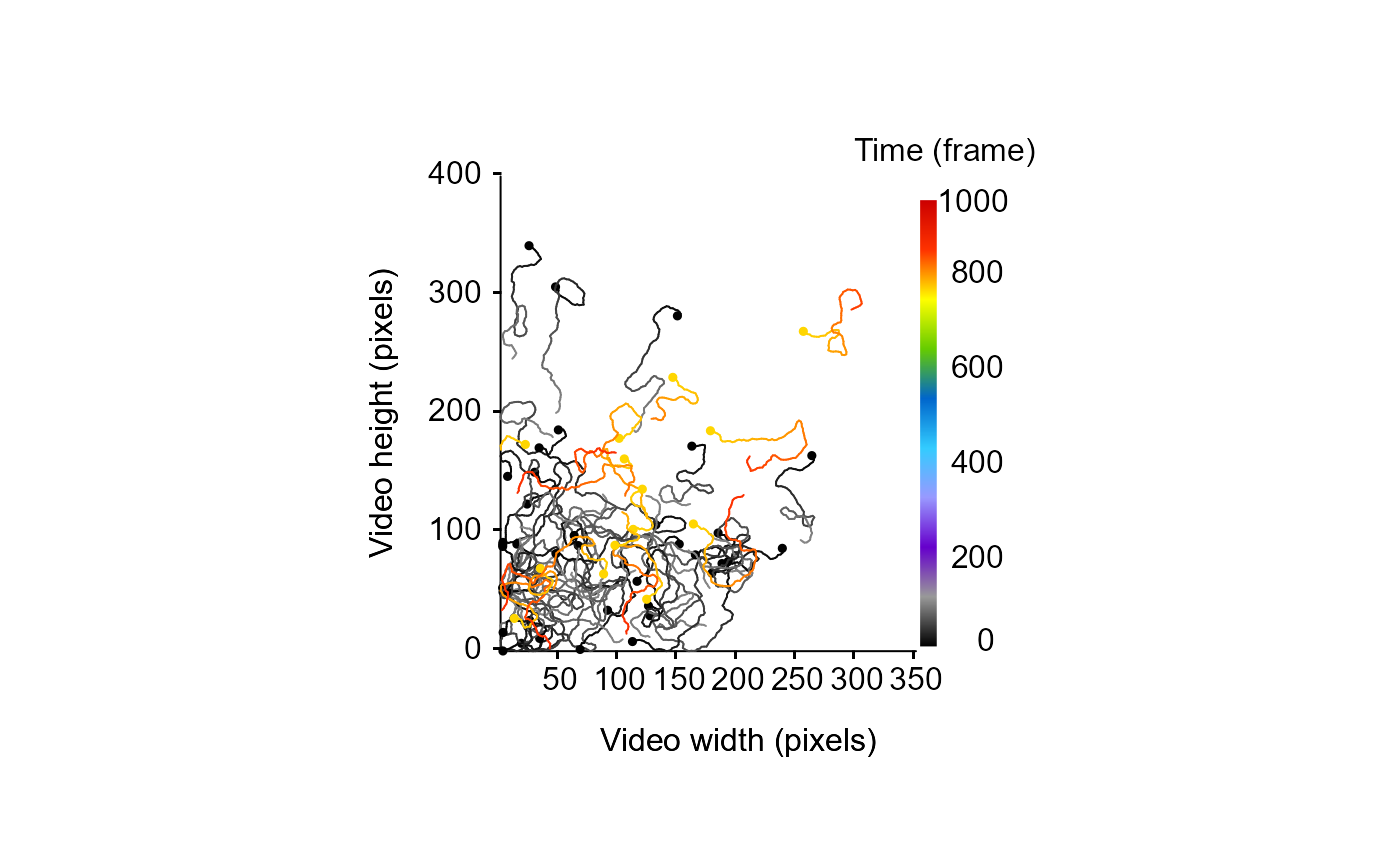
 # example 3: draw tracklets according to time intervals (first interval 1 to 100, second interval 800 to 900 frames)
MoveR::drawTracklets(TrackList,
timeWin = list(c(1, 100), c(800, 900)),
axLabPos = c(1, -6))
 # example 4: draw tracklets according to time intervals (first interval 1 to 100, second interval 800 to 900 frames)
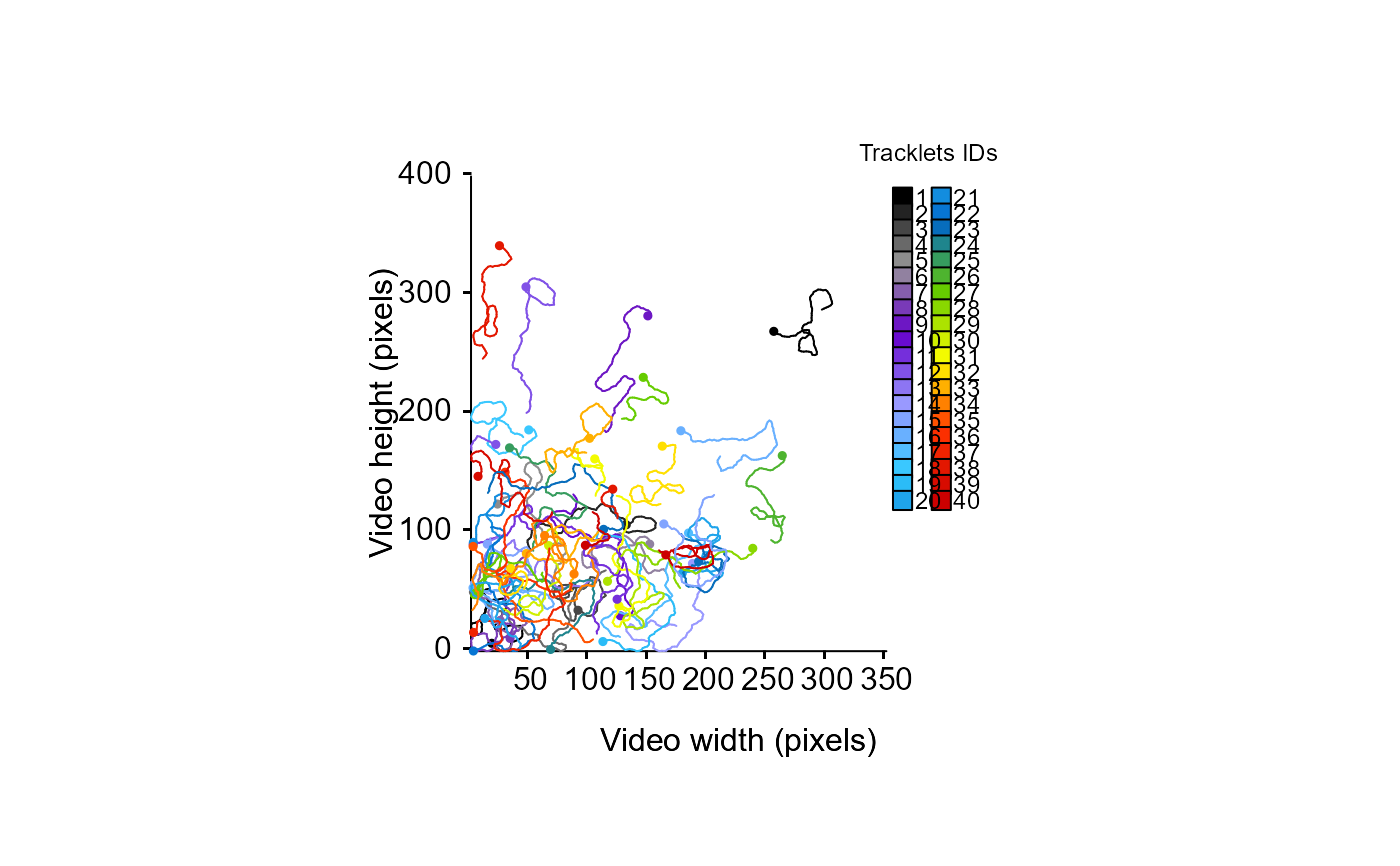
# and color the tracklets according to their Id instead of time elapsed
MoveR::drawTracklets(TrackList,
timeWin = list(c(1, 100), c(800, 900)),
colId = "tracklets",
axLabPos = c(1, -6),
cex.leg = 0.75,
ncol.leg = 2)
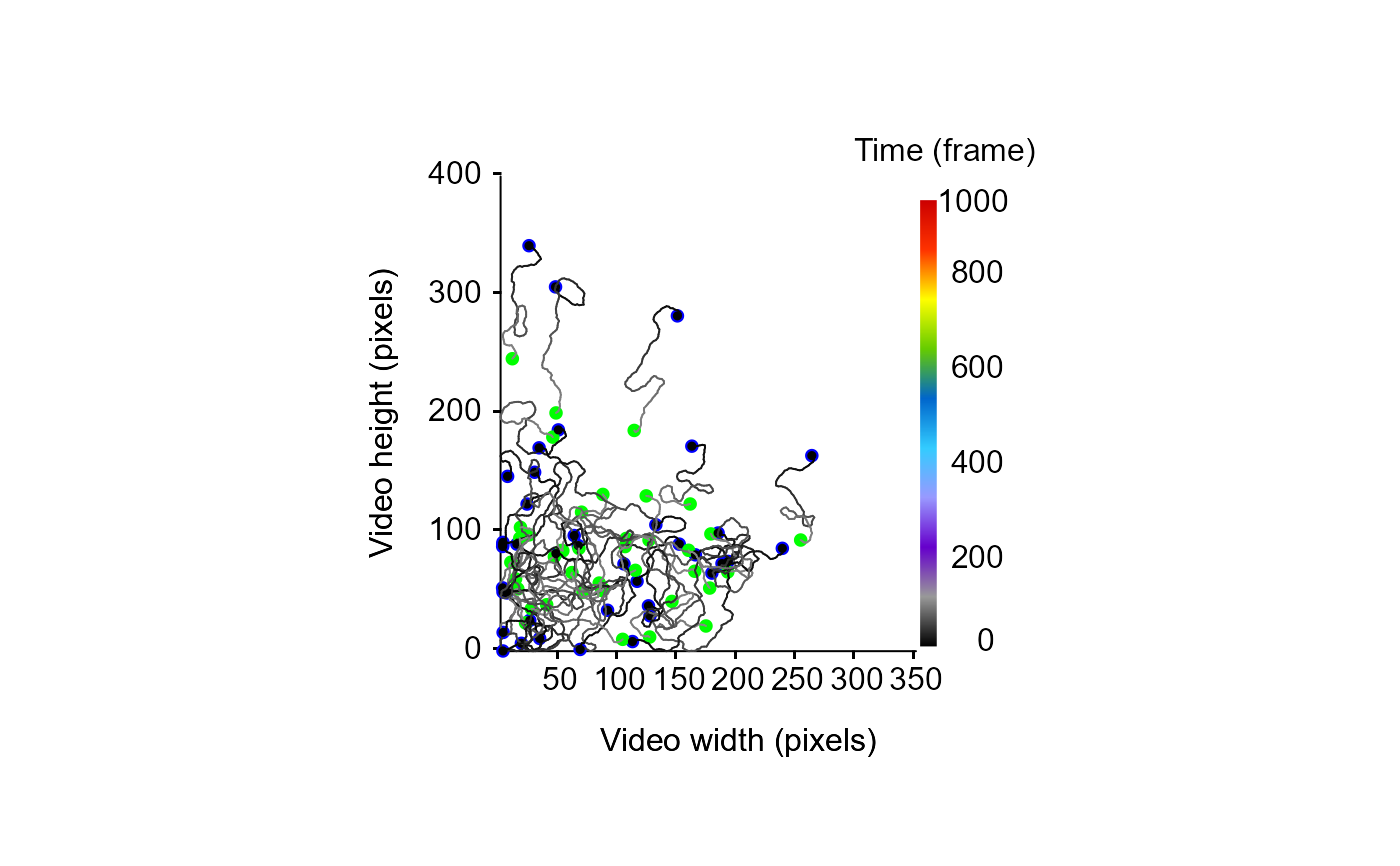
 # example 5: draw tracklets according to time interval (interval 1 to 100) and add dummy points on the plot
# (here we draw the starting and ending points of each tracklets in blue and green respectively)
MoveR::drawTracklets(TrackList,
timeWin = list(c(1, 100)),
axLabPos = c(1, -6),
add2It = list(for (j in seq(TrackList)) {
points(
TrackList[[j]]$x.pos[TrackList[[j]]$frame == 1],
TrackList[[j]]$y.pos[TrackList[[j]]$frame == 1],
col = "blue",
pch = 19,
cex = 0.8
)
}, for (l in seq(TrackList)) {
points(
TrackList[[l]]$x.pos[TrackList[[l]]$frame == 100],
TrackList[[l]]$y.pos[TrackList[[l]]$frame == 100],
col = "green",
pch = 19,
cex = 0.8
)
}))
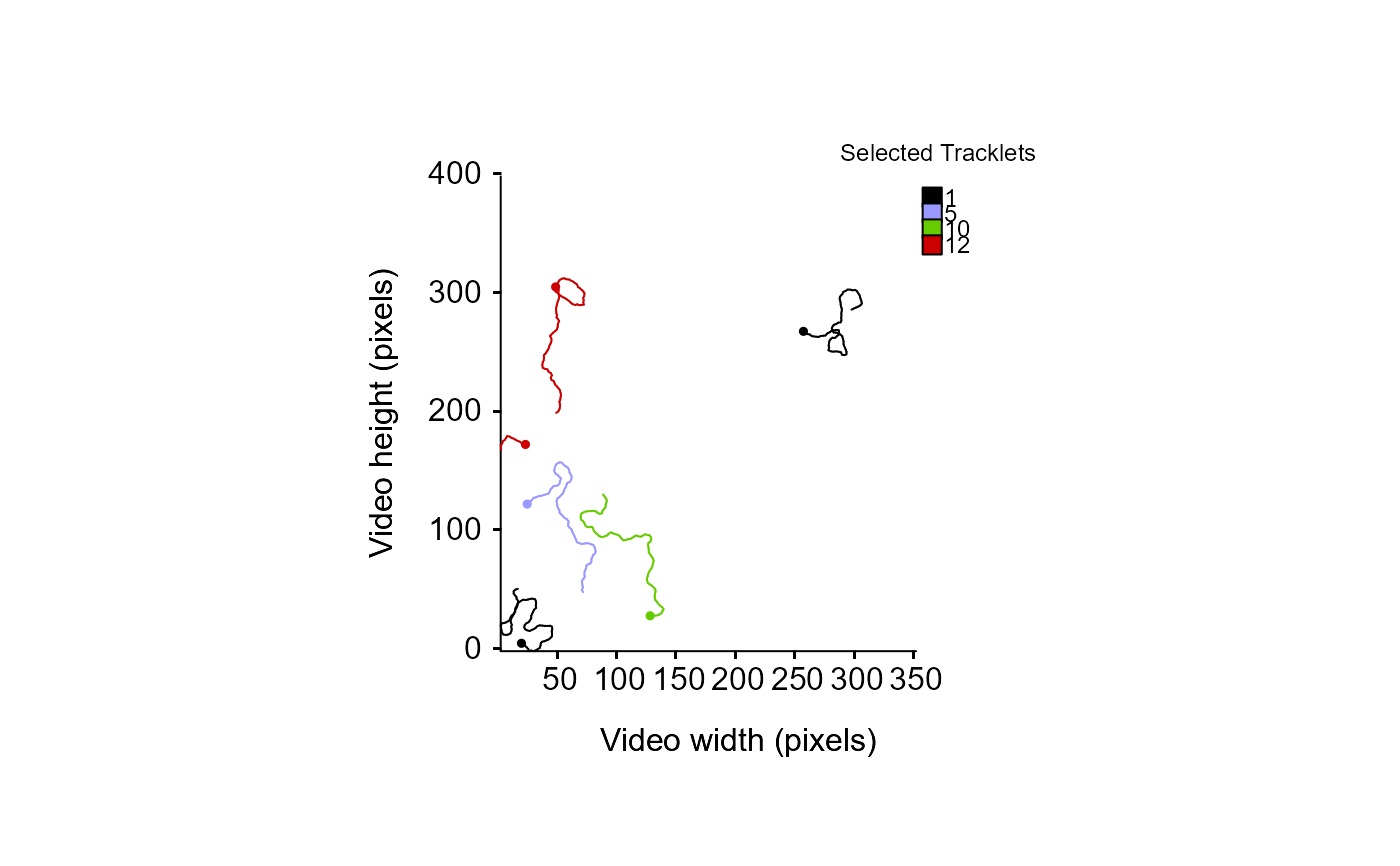
 # example 6: select some tracklets, time windows and color tracklet according to their id
MoveR::drawTracklets(TrackList,
selTrack = names(TrackList)[c(1, 5, 10, 12)],
timeWin = list(c(1, 100), c(800, 1000)),
colId = "selTrack",
axLabPos = c(1, -6),
cex.leg = 0.75)
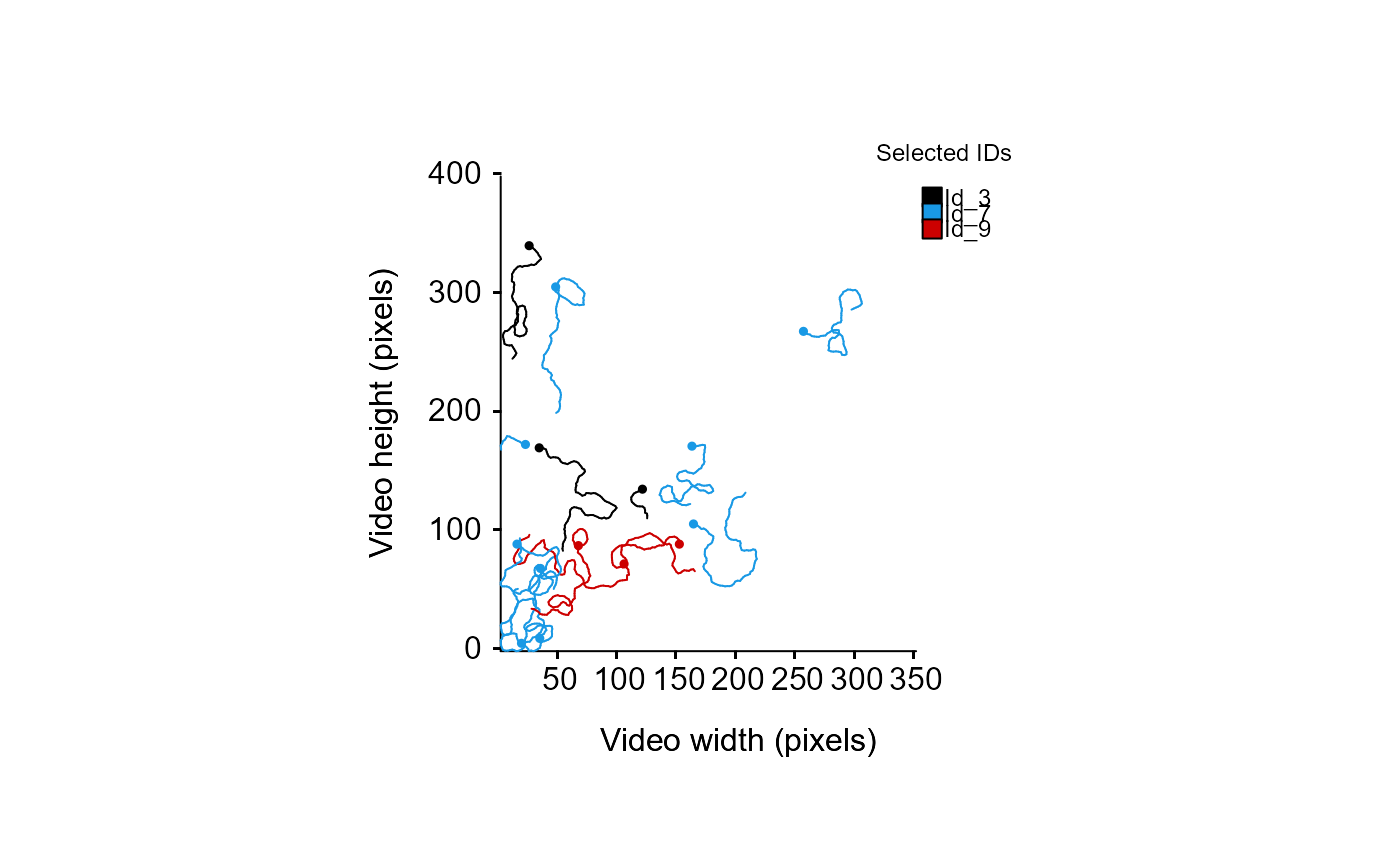
 # example 7: select some particles' identity, time windows and color tracklet (all tracklets belonging to the selected particles' identity) according to particles identity
## identify particles' identity
ids <- unique(unlist(lapply(TrackList, function(x)
MoveR::listGet(x, "identity"))))
MoveR::drawTracklets(TrackList,
selId = ids[c(1, 5, 10)],
timeWin = list(c(1, 100), c(800, 1000)),
colId = "selId",
axLabPos = c(1, -6),
cex.leg = 0.75)
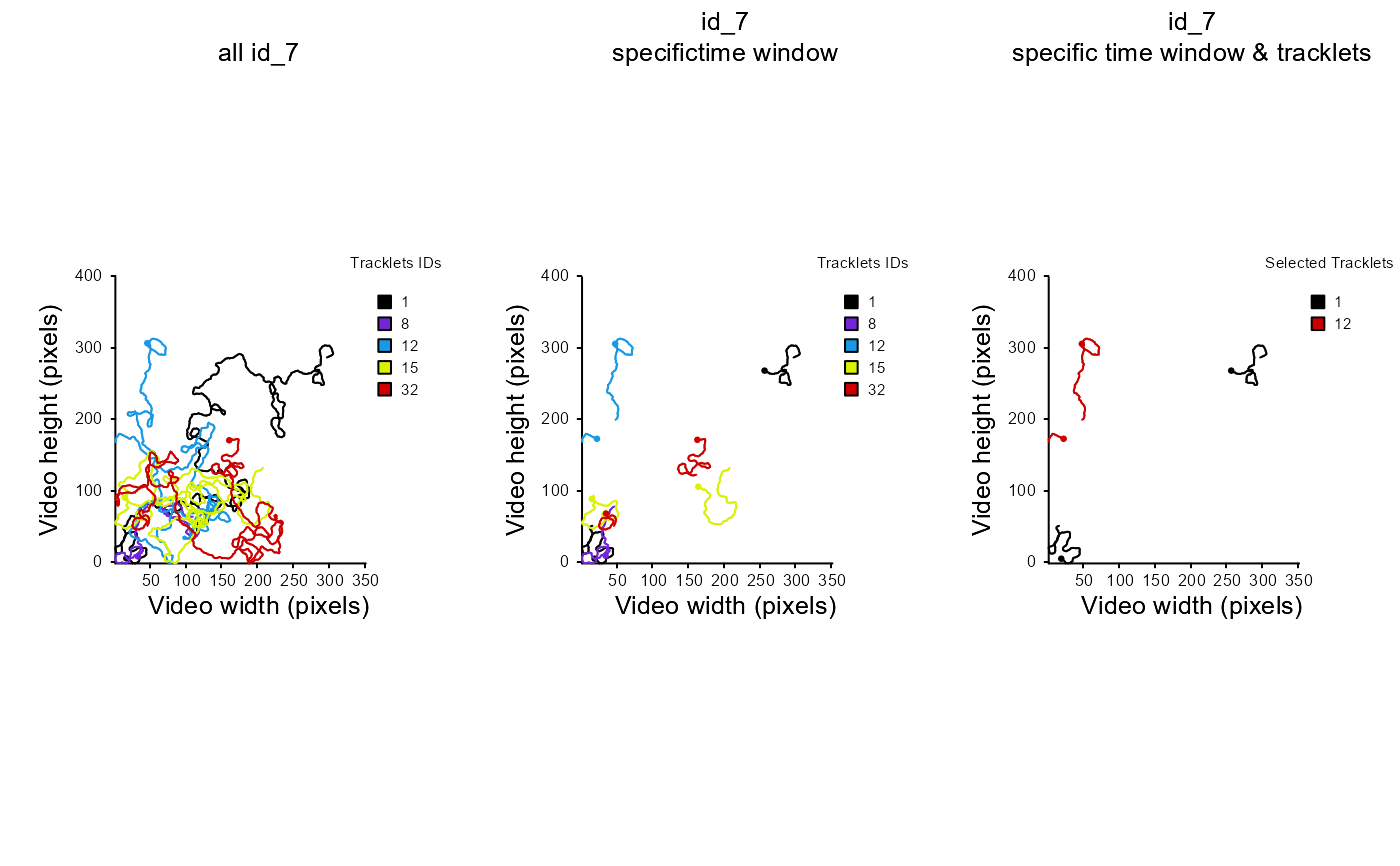
 # example 8: make a panel plot with
# 1- all tracklets belonging to a given particle's identity
# 2- all tracklets belonging to a given particle's identity on a specific time window
# 3- Specific tracklets belonging to a given particle's identity on a specific time window
par(mfrow=c(1,3))
#1
MoveR::drawTracklets(TrackList,
selId = ids[1],
colId = "tracklets",
axLabPos = c(-6, 2),
cex.leg = 0.75,
cex.axis = 0.8,
cex.lab = 0.8,
ncol.leg = 1,
main = "all id_7",
cex.main = 0.8)
#2
MoveR::drawTracklets(TrackList,
selId = ids[1],
timeWin = list(c(1, 100), c(800, 1000)),
colId = "tracklets",
axLabPos = c(-6, 2),
cex.leg = 0.75,
cex.axis = 0.8,
cex.lab = 0.8,
ncol.leg = 1,
main = "id_7\nspecifictime window",
cex.main = 0.8)
#3
MoveR::drawTracklets(TrackList,
selTrack = names(TrackList)[c(1, 12)],
selId = ids[1],
timeWin = list(c(1, 100), c(800, 1000)),
colId = "selTrack",
axLabPos = c(-6, 2),
cex.leg = 0.75,
cex.axis = 0.8,
cex.lab = 0.8,
ncol.leg = 1,
main = "id_7\nspecific time window & tracklets",
cex.main = 0.8)
