Compute the total surface explored and display the corresponding heatmap.
Source:R/exploredArea.R
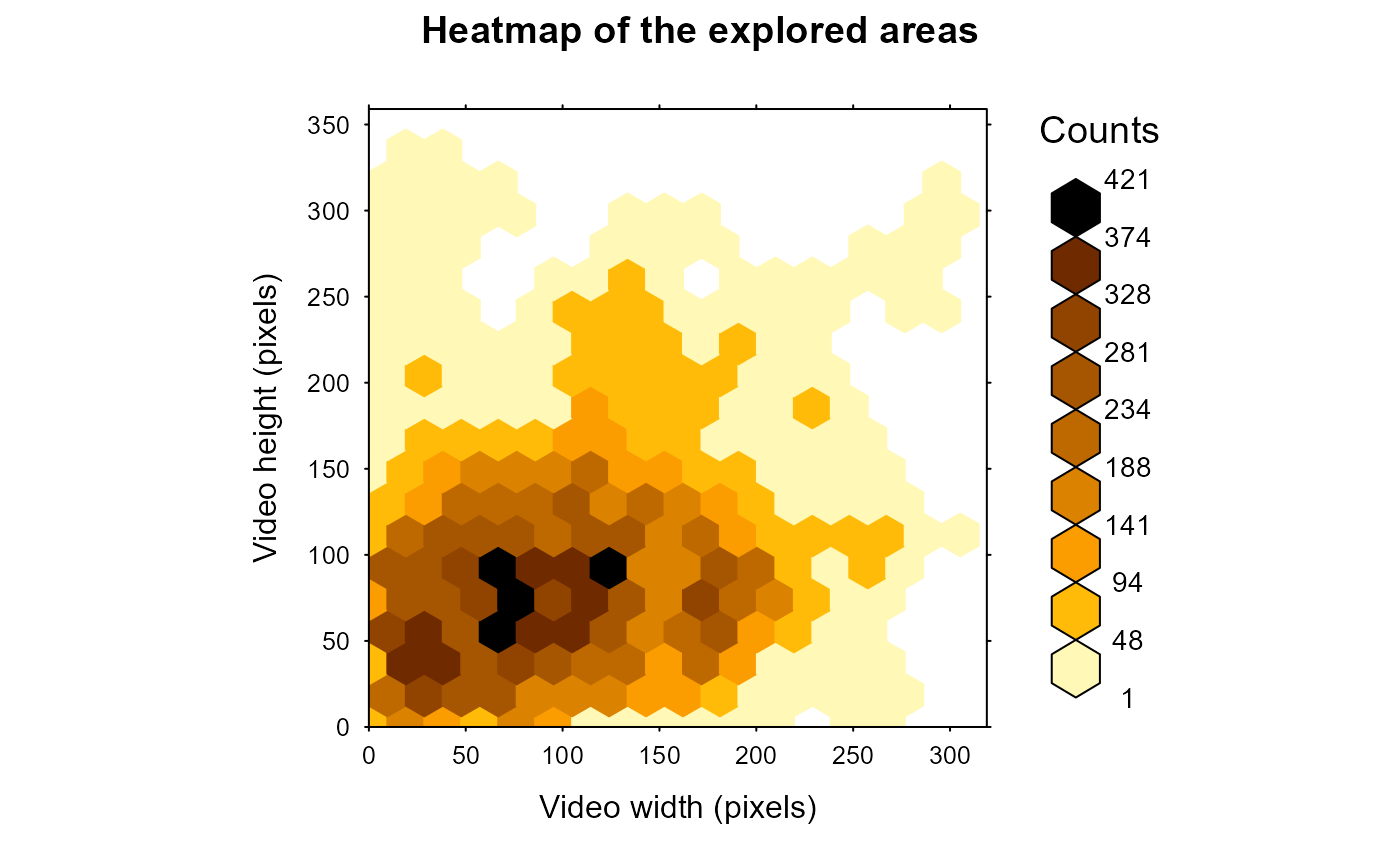
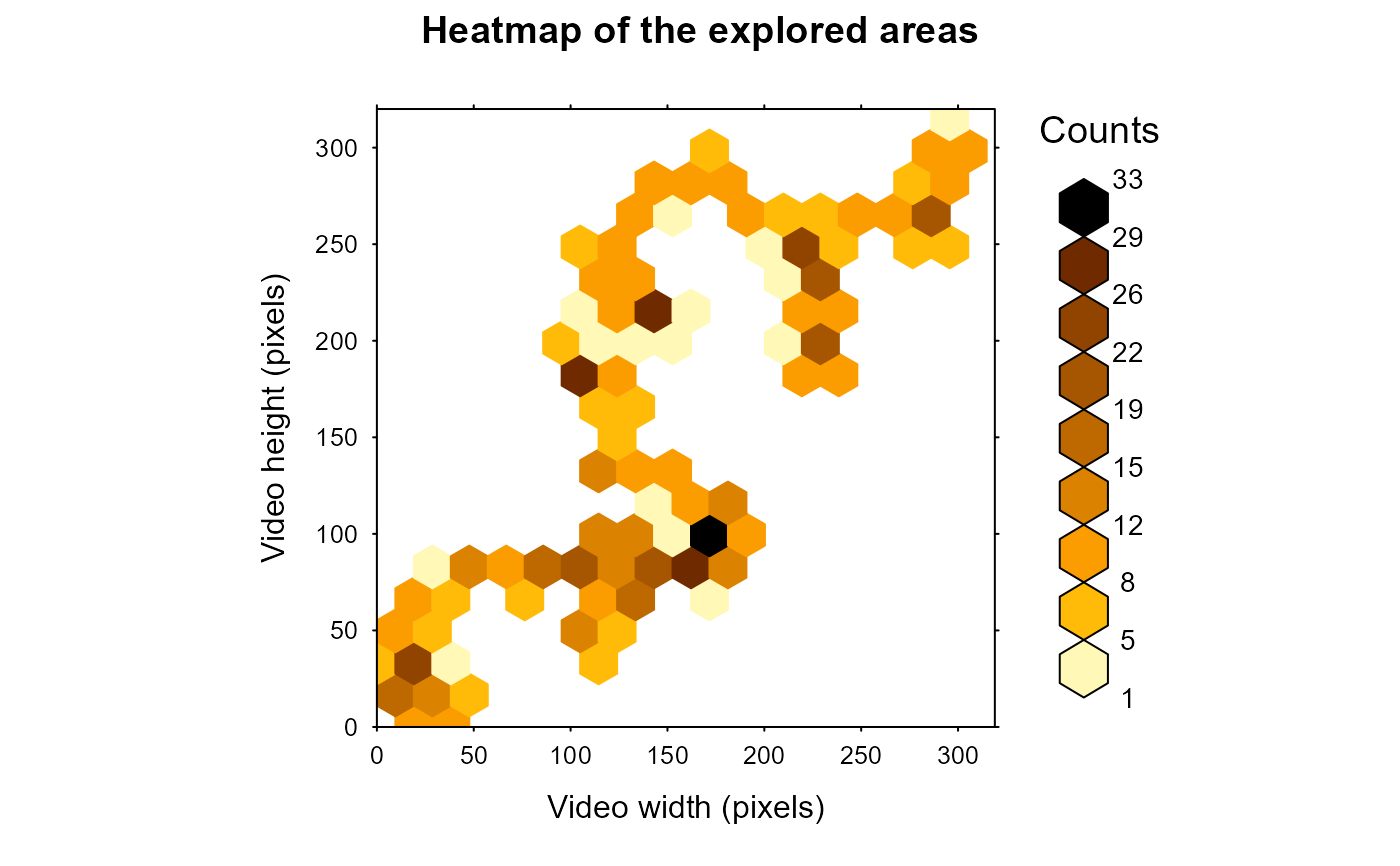
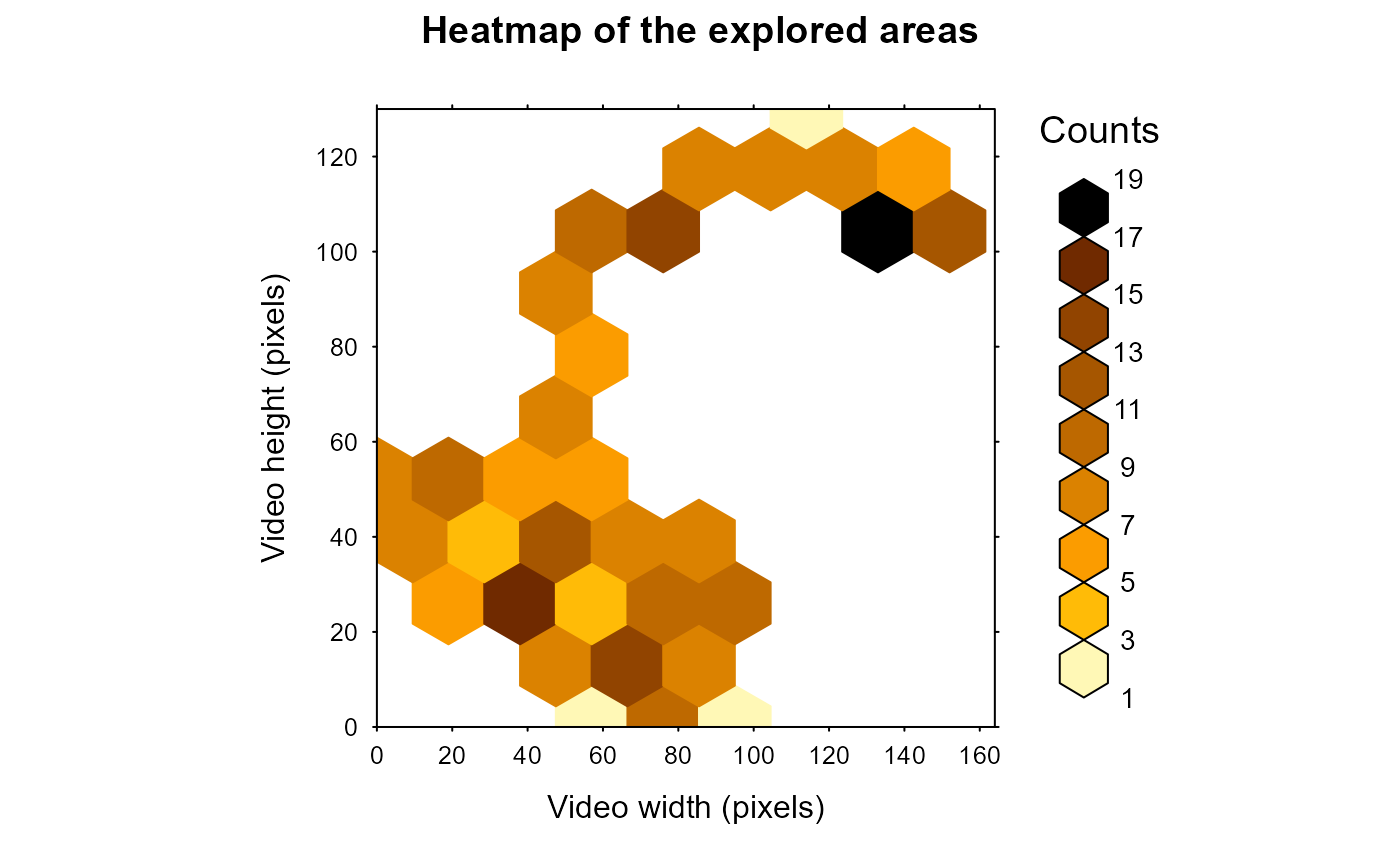
exploredArea.RdGiven an object of class "tracklets" containing a list of tracklets or a dataframe containing the information for a given tracklet, and a value of reaction distance this function displays an heatmap (i.e., hexbin plot) of the explored areas and returns the total surface explored in a geometrically consistent and scalable manner.
Arguments
- trackDat
An object of class "tracklets" containing a list of tracklets and their characteristics classically used for further computations (at least x.pos, y.pos, frame), or a data frame containing tracking information for one tracklet.
- binRad
A numeric value, expressed in pixels, corresponding to the diameter of the typical surface a particle can "explore" around its position.
- imgRes
A vector of 2 numeric values, the resolution of the video used as x and y limit of the plot (i.e., the number of pixels in image width and height). If imgRes is unspecified, the function try to retrieve it from tracklets object attribute or approximate it using x and y maximum values + 5%.
- scale
A ratio corresponding to the scaling factor to be applied to the trajectory coordinates (default = 1).
- timeCol
A character string corresponding to the name of the column containing Time information (e.g., "frame").
- timeWin
A list of one or several vector containing 2 numeric values separated by a comma corresponding to the time interval between which the tracklets have to be drawn according to timeCol (optional).
- graph
A logical value (i.e., TRUE or FALSE) indicating whether the various diagnostics plots should be displayed or not (default = TRUE).
- saveGraph
A logical value (i.e., TRUE or FALSE) indicating whether the heatmap should be saved as a .tiff file in the hardrive - within the working directory (default = FALSE). Alternatively, the user can specify the saving function and hence the extension and the directory where the heatmap should be saved (see for instance
png,jpegortiff.
Value
This function returns the total surface explored in a geometrically consistent and scalable manner and if graph argument is TRUE, it displays an heatmap (i.e., hexbin plot) of the explored areas.
Examples
set.seed(2023)
# generate some dummy tracklets
## start to specify some parameters to generate tracklets
TrackN <- 40 # the number of tracklet to simulate
TrackL <-
  1:1000 # the length of the tracklets or a sequence to randomly sample tracklet length
id <- 0
TrackList <- MoveR::trackletsClass(stats::setNames(lapply(lapply(seq(TrackN), function(i)
  trajr::TrajGenerate(sample(TrackL, 1), random = TRUE, fps = 1)), function(j) {
    id <<- id + 1
    data.frame(
      x.pos = j$x - min(j$x),
      y.pos = j$y - min(j$y),
      frame = j$time,
      identity = paste("Tracklet", id, sep = "_")
    )
  }), seq(TrackN)))

# check the tracklets
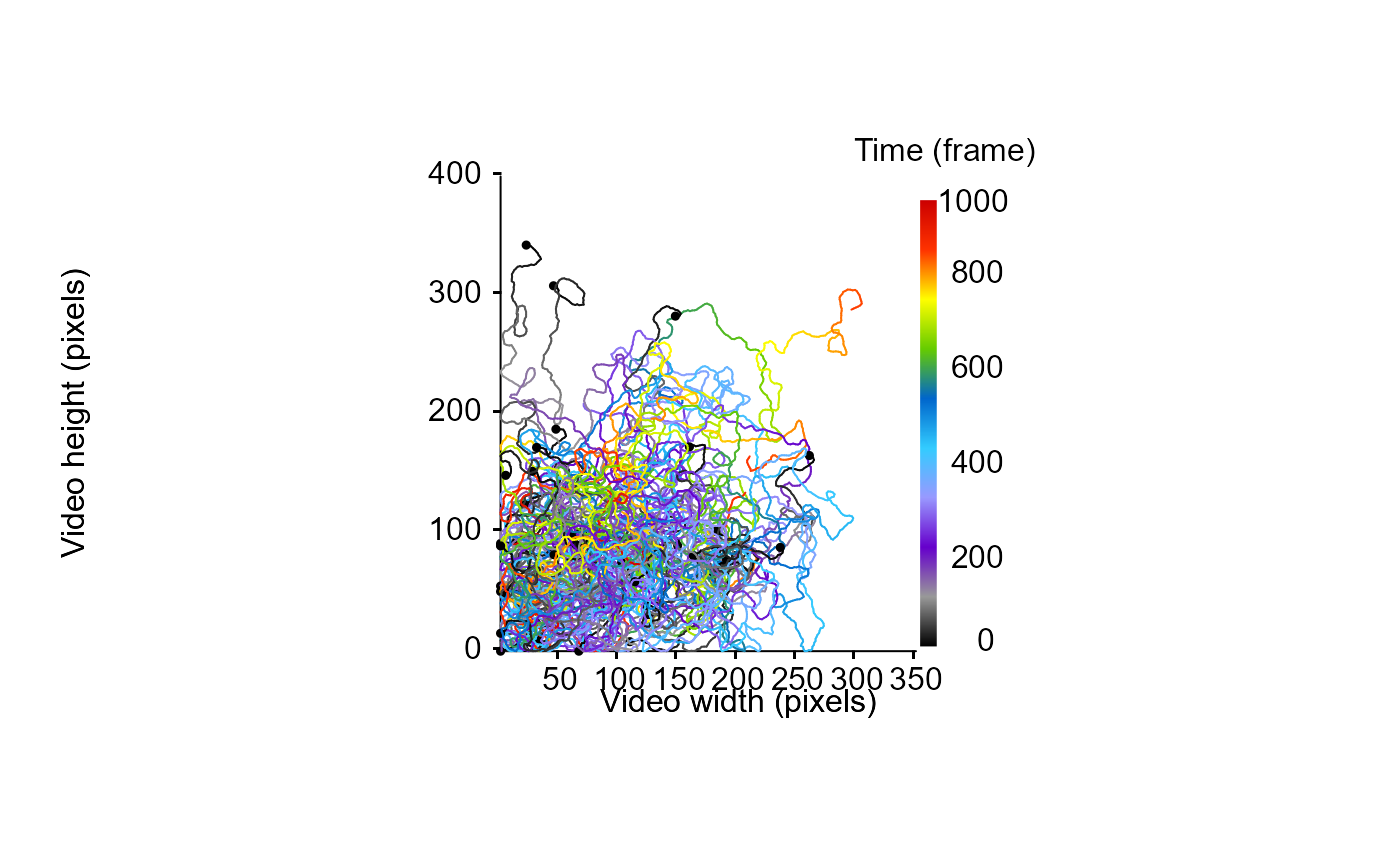
MoveR::drawTracklets(TrackList)


# compute the total surface explored and displays the heatmap for all tracklets
# NB: Plot can be displayed and/or saved using graph and saveGraph arguments
MoveR::exploredArea(TrackList,
                    binRad = 20,
                    scale = 1,
                    timeCol = "frame")

#> [1] 76210.24

# compute the surface explored for each tracklet and display (but do not save) the heatmap for the 2 first tracklets
# by combining exploredArea and analyseTracklets, the surface explored for each tracklet is appended to the data
# of the corresponding tracklets.
subTracklets <- MoveR::trackletsClass(TrackList[1:2])
ExplorTest <- MoveR::analyseTracklets(subTracklets,
                                  customFunc = list(
                                    exploredArea = function(x)
                                      MoveR::exploredArea(
                                        x,
                                        binRad = 20,
                                        scale = 1,
                                        timeCol = "frame"
                                      )
                                  ))


str(ExplorTest)
#> List of 2
#>  $ 1:'data.frame':	886 obs. of  5 variables:
#>   ..$ x.pos       : num [1:886] 15.3 17.5 19.5 20.6 21.9 ...
#>   ..$ y.pos       : num [1:886] 7.13 6.64 5.92 4.52 3.17 ...
#>   ..$ frame       : num [1:886] 0 1 2 3 4 5 6 7 8 9 ...
#>   ..$ identity    : chr [1:886] "Tracklet_1" "Tracklet_1" "Tracklet_1" "Tracklet_1" ...
#>   ..$ exploredArea: num [1:886] 28406 28406 28406 28406 28406 ...
#>  $ 2:'data.frame':	280 obs. of  5 variables:
#>   ..$ x.pos       : num [1:280] 129 131 133 135 136 ...
#>   ..$ y.pos       : num [1:280] 106 106 107 108 109 ...
#>   ..$ frame       : num [1:280] 0 1 2 3 4 5 6 7 8 9 ...
#>   ..$ identity    : chr [1:280] "Tracklet_2" "Tracklet_2" "Tracklet_2" "Tracklet_2" ...
#>   ..$ exploredArea: num [1:280] 11778 11778 11778 11778 11778 ...
#>  - attr(*, "class")= chr "tracklets"